HOT TOPICS LIST
- MACD
- Fibonacci
- RSI
- Gann
- ADXR
- Stochastics
- Volume
- Triangles
- Futures
- Cycles
- Volatility
- ZIGZAG
- MESA
- Retracement
- Aroon
INDICATORS LIST
LIST OF TOPICS
PRINT THIS ARTICLE
by Donald W. Pendergast, Jr.
The best trade setups often appear with little warning or fanfare; Sara Lee shares may be offering a nice low-risk long setup right now.
Position: Buy
Donald W. Pendergast, Jr.
Donald W. Pendergast is a financial markets consultant who offers specialized services to stock brokers and high net worth individuals who seek a better bottom line for their portfolios.
PRINT THIS ARTICLE
TRADING SYSTEMS
Is Sara Lee A Piece Of Cake?
09/15/09 11:13:36 AMby Donald W. Pendergast, Jr.
The best trade setups often appear with little warning or fanfare; Sara Lee shares may be offering a nice low-risk long setup right now.
Position: Buy
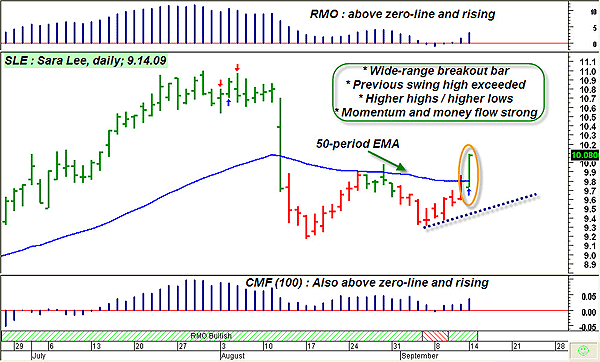
| Shares of Sara Lee (SLE) went into a long-term tailspin after 2004, shedding about 70% of their value over a four-year period. The stock bottomed at $6.80 in March 2009 and has since managed to right itself, rising to $11 by late July. Let's look at SLE's daily chart (Figure 1) and see what may be on the table for enterprising traders. |

|
| FIGURE 1: SLE, DAILY. Here's a solid, wide-range breakout bar, one taking out a prior swing high and the 50-day EMA -- and with healthy long-term money flows and rising price momentum. |
| Graphic provided by: MetaStock. |
| |
| Figure 1 paints a convincing image of a strong breakout; note the wide-range daily bar that generated today's RMO (Rahul Mohindar) swing buy signal. This bar also took out the prior swing high at $9.98 and has also confirmed the sequence of higher swing highs and higher swing lows, the very definition of an uptrend. At the top of the chart the RMO oscillator also confirms the upward momentum behind Sara Lee, just as the Chaikin money flow (CMF)(100) indicator (bottom of the chart) confirms the continual long-term inflow of money into this stock. Another helpful confirmation is that the 50-period EMA (blue line) has also been exceeded on this wide-range breakout. Even better is the fact that SLE's weekly price cycle (not shown) has just turned higher. All in all, this trade setup has a lot going for it. |

|
| FIGURE 2: COVERED CALL. Compared to a 2% yearly CD return, selling a low-risk covered call makes a lot of sense, all else being equal. |
| Graphic provided by: ThinkorSwim SLE call prices. |
| |
| There is a very nice covered call play available for SLE, one with a short-term expiration date and a healthy annualized rate of return (Figure 2). Selling one October 2009 $10 call option (SLEJB) against every 100 shares you acquire of SLE will provide you with an at-the-money covered call that will earn about 40% annualized if the shares are called away at $10 on October 16, 2009. The call has a current bid of $0.40 and if you can work that up to $0.45 or even $0.50, your rate of return should be even better. To manage the trade, consider running a simple daily trendline stop, similar to the one shown on the chart (blue dashed line). This trendline, when extended, should give the trade plenty of room to accommodate random back and fill price action but without allowing the trade to turn into a substantial loser. Plan on holding the covered call position until expiration or until you see a confirmed daily close of SLE beneath that blue uptrend line. |
| This trade carries an initial risk of about $50 (if immediately stopped out by the uptrend line), so if you have a $25,000 trading account and wish to risk a maximum of 1% on this setup, you'd be able to acquire five of these covered calls without going overboard with your account risk. It could be a low-risk trade setup to consider, especially since the broad stock indexes keep chugging ever higher. |
Donald W. Pendergast is a financial markets consultant who offers specialized services to stock brokers and high net worth individuals who seek a better bottom line for their portfolios.
| Title: | Writer, market consultant |
| Company: | Linear Trading Systems LLC |
| Jacksonville, FL 32217 | |
| Phone # for sales: | 904-239-9564 |
| E-mail address: | lineartradingsys@gmail.com |
Traders' Resource Links | |
| Linear Trading Systems LLC has not added any product or service information to TRADERS' RESOURCE. | |
Click here for more information about our publications!
Comments
Date: 09/15/09Rank: 4Comment:

Request Information From Our Sponsors
- StockCharts.com, Inc.
- Candle Patterns
- Candlestick Charting Explained
- Intermarket Technical Analysis
- John Murphy on Chart Analysis
- John Murphy's Chart Pattern Recognition
- John Murphy's Market Message
- MurphyExplainsMarketAnalysis-Intermarket Analysis
- MurphyExplainsMarketAnalysis-Visual Analysis
- StockCharts.com
- Technical Analysis of the Financial Markets
- The Visual Investor
- VectorVest, Inc.
- Executive Premier Workshop
- One-Day Options Course
- OptionsPro
- Retirement Income Workshop
- Sure-Fire Trading Systems (VectorVest, Inc.)
- Trading as a Business Workshop
- VectorVest 7 EOD
- VectorVest 7 RealTime/IntraDay
- VectorVest AutoTester
- VectorVest Educational Services
- VectorVest OnLine
- VectorVest Options Analyzer
- VectorVest ProGraphics v6.0
- VectorVest ProTrader 7
- VectorVest RealTime Derby Tool
- VectorVest Simulator
- VectorVest Variator
- VectorVest Watchdog
