HOT TOPICS LIST
- MACD
- Fibonacci
- RSI
- Gann
- ADXR
- Stochastics
- Volume
- Triangles
- Futures
- Cycles
- Volatility
- ZIGZAG
- MESA
- Retracement
- Aroon
INDICATORS LIST
LIST OF TOPICS
PRINT THIS ARTICLE
by Chaitali Mohile
The bearish reversal conditions on the daily time frame of Schering Plough resulted in a short-term bearish breakout.
Position: Buy
Chaitali Mohile
Active trader in the Indian stock markets since 2003 and a full-time writer. Trading is largely based upon technical analysis.
PRINT THIS ARTICLE
WEDGE FORMATIONS
Schering Plough Ignores Breakout
09/11/09 01:18:39 PMby Chaitali Mohile
The bearish reversal conditions on the daily time frame of Schering Plough resulted in a short-term bearish breakout.
Position: Buy
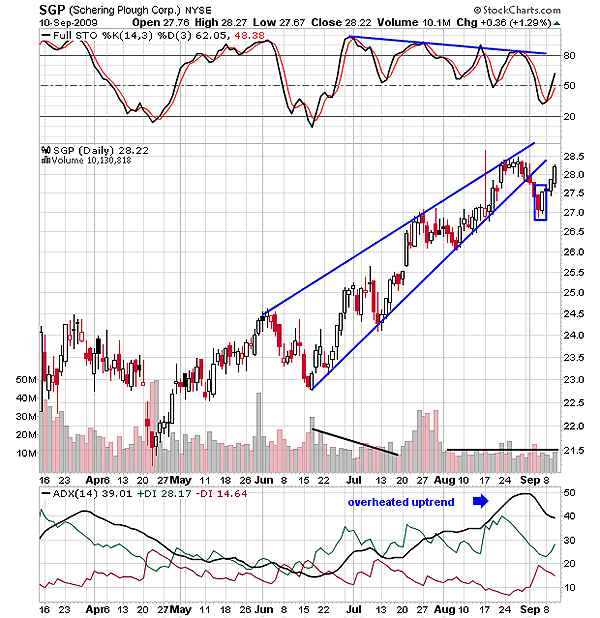
| An uptrend for Schering Plough Inc. (SGP) developed gradually with bullish price movement. SGP comfortably moved higher, forming higher tops and higher bottoms. The encouraging volume at an early stage of the rally (June) boosted the bullish strength and dragged the stock upward. The full stochastic (14,3,3) sharply recovered from an oversold area, opening up a fresh demand for SGP. The average direction movement index (ADX) (14) in Figure 1 shows a steady growth in an uptrend. Therefore, the higher tops and bottoms were completely supported by the bullish developing indicators. |
| Later, volume shrank due to the lower peaks formed by the stochastic oscillator, but the price continued to surge. Thus, a negative divergence for the bullish rally was reflected in Figure 1. The stock movement narrowed, forming a bearish reversal pattern known as a rising wedge. The pattern began with a wide mouth and converged at higher levels as traders withdrew in anticipation of a bearish breakout. The pattern in Figure 1 is an echo of the negative divergence by the full stochastic (14,3,3) and the highly overheated uptrend indicated by the ADX (14). |

|
| FIGURE 1: SGP, DAILY. The bearish breakout of the rising wedge failed as SGP moved upward. |
| Graphic provided by: StockCharts.com. |
| |
| We can see that the trend indicator moved above 45 levels, indicating a trend reversal possibility. However, the ADX (14) can hit extreme overheated levels above 55 or 60 and then may change direction. But in Figure 1, the ADX (14) declined immediately from 50 levels, resulting in a bearish breakout of the pattern. In addition, the momentum oscillator slipped from an overbought region. Thus, the bearish breakout levels would have been a best short-term selling point for many traders. |
| Before the trade could enter in more profits, the full stochastic (14,3,3) established support at the 50 level and moved upward. This signified that SGP had strong bullish momentum and was not ready to give up its bullish hold on the rally. By sustaining above 50 levels, the indicator obstructed a fresh selling pressure in the rally. Meanwhile, the declining ADX (14) marginally moved below 40 levels with robust buying pressure, reflecting the strong uptrend. Together, everything resulted in a new upward rally, ignoring the previous bearish breakout of the rising wedge. In Figure 1, SGP regained its lost levels and was about to breach the lower trendline resistance of the rising wedge. Traders can trigger the fresh long positions above $28.50 and enjoy good profits. SGP could have been a good example of a breakout failure if it climbed above the upper trendline resistance. |
Active trader in the Indian stock markets since 2003 and a full-time writer. Trading is largely based upon technical analysis.
| Company: | Independent |
| Address: | C1/3 Parth Indraprasth Towers. Vastrapur |
| Ahmedabad, Guj 380015 | |
| E-mail address: | chaitalimohile@yahoo.co.in |
Traders' Resource Links | |
| Independent has not added any product or service information to TRADERS' RESOURCE. | |
Click here for more information about our publications!
PRINT THIS ARTICLE

Request Information From Our Sponsors
- StockCharts.com, Inc.
- Candle Patterns
- Candlestick Charting Explained
- Intermarket Technical Analysis
- John Murphy on Chart Analysis
- John Murphy's Chart Pattern Recognition
- John Murphy's Market Message
- MurphyExplainsMarketAnalysis-Intermarket Analysis
- MurphyExplainsMarketAnalysis-Visual Analysis
- StockCharts.com
- Technical Analysis of the Financial Markets
- The Visual Investor
- VectorVest, Inc.
- Executive Premier Workshop
- One-Day Options Course
- OptionsPro
- Retirement Income Workshop
- Sure-Fire Trading Systems (VectorVest, Inc.)
- Trading as a Business Workshop
- VectorVest 7 EOD
- VectorVest 7 RealTime/IntraDay
- VectorVest AutoTester
- VectorVest Educational Services
- VectorVest OnLine
- VectorVest Options Analyzer
- VectorVest ProGraphics v6.0
- VectorVest ProTrader 7
- VectorVest RealTime Derby Tool
- VectorVest Simulator
- VectorVest Variator
- VectorVest Watchdog
