HOT TOPICS LIST
- MACD
- Fibonacci
- RSI
- Gann
- ADXR
- Stochastics
- Volume
- Triangles
- Futures
- Cycles
- Volatility
- ZIGZAG
- MESA
- Retracement
- Aroon
INDICATORS LIST
LIST OF TOPICS
PRINT THIS ARTICLE
by Donald W. Pendergast, Jr.
After dropping below $4 per share on November 21, 2008, Coeur d'Alene common shares have staged a remarkable comeback.
Position: Accumulate
Donald W. Pendergast, Jr.
Donald W. Pendergast is a financial markets consultant who offers specialized services to stock brokers and high net worth individuals who seek a better bottom line for their portfolios.
PRINT THIS ARTICLE
KELTNER CHANNELS
Coeur d'Alene Breaking Higher
09/11/09 12:54:27 PMby Donald W. Pendergast, Jr.
After dropping below $4 per share on November 21, 2008, Coeur d'Alene common shares have staged a remarkable comeback.
Position: Accumulate
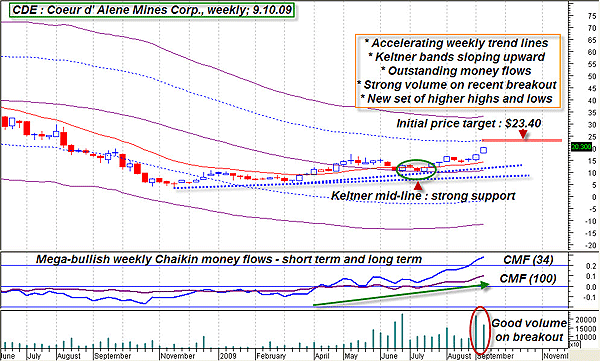
| Shares of most precious metals (PM) mining companies plunged right along with the rest of the broad market in 2008, despite having above-average fundamentals in their favor. Coeur d'Alene (CDE) got hit exceptionally hard, dropping like a rock from $51.80 in March 2008 to $3.60 at the market bottom in late November 2008. That's a 93% haircut, for all you bean-counters out there, and it's little wonder that many PM bulls, me included, had begun to wonder if this century-old miner's stock price could begin to recover even a small portion of those staggering losses. But that was then; CDE is now back above $20 per share, having just staged a remarkably bullish breakout on its daily chart. Right now, though, we'll start with CDE's weekly chart (Figure 1) to get a sense of the larger-dimension uptrend in this Idaho-based mining stock. |

|
| FIGURE 1: CDE, WEEKLY. This weekly chart offers a convincing demonstration of a powerful uptrend on the move. Money flow, momentum, and volume are all suggesting more gains to come. |
| Graphic provided by: MetaStock. |
| Graphic provided by: WB Keltner Channels EOD from ProfitTrader. |
| |
| While the most exciting action is on CDE's daily chart, the weekly chart helps confirm what PM bulls have known for several months, that CDE is in the midst of a major trending move. All of the key ingredients needed to support that assertion are present -- from terrific and strong money flows (the Chaikin 100 and 34-period money flow indicators [CMF][100] and [CMF][34]), a new sequence of higher highs and higher lows, excellent weekly volume on the recent breakout, all the way to an entire Keltner band complex that is sloping upward. Note how the Keltner band in midline (a 45-week exponential average [EMA]) acted as rock-solid support prior to the strong break higher. This kind of Keltner support/resistance action happens time and again in every time frame and in all kinds of markets, so note any similar setups that may appear; it can be a great prebreakout confirmation tool. Now, we'll jump over to CDE's daily graph, for more technical confirmation. |

|
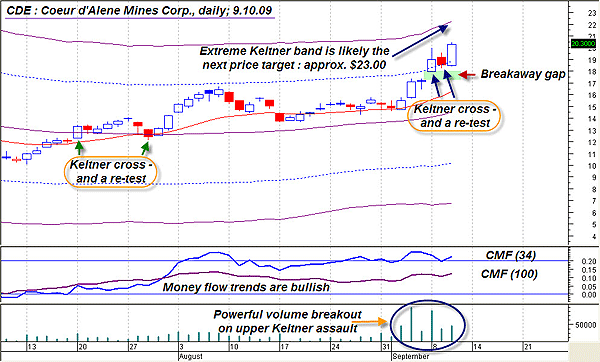
| FIGURE 2: CDE, DAILY. Breakouts above/below each Keltner band level are usually significant technical events, especially when a former resistance band is transformed into a valid support level. |
| Graphic provided by: MetaStock. |
| Graphic provided by: WB Keltner Channels EOD from ProfitTrader. |
| |
| Once again, CDE shines in its daily chart (Figure 2). Powerful money flow and volume characteristics are a must for any trend to continue, and CDE has plenty of both attributes. The Keltner band action is also very instructive; on the left side of the chart we see the initial Keltner midline crossing, followed by a successful retest (prior resistance becomes a new support level). Then on the right side of the chart we see the recent breakaway gap, immediately followed by a break above the upper Keltner band, which also experienced a quick, successful test of support. Normally, when the upper Keltner band is breached (followed by a successful retest) on heavy volume, there is a high probability that price will continue to trend up toward the extreme upper Keltner band. That's what appears to be occurring now -- CDE is making a run toward the extreme upper band on its daily chart at the same time it is making a move toward its upper weekly Keltner band. All told, a very bullish set of images from the daily and weekly time frames. |

|
| FIGURE 3: COVERED CALLS. Selling an in-the money covered call (the October $17.50 call at $3.50) offers more staying power to ride out temporary reversals, but the best potential percentage returns (85% annualized) is offered by selling the at-the-money October $20 covered call. |
| Graphic provided by: ThinkorSwim CDE option quotes. |
| |
| Trading and investing ideas for CDE? Perhaps. There are a couple of ways to go, so I'll just give a thumbnail sketch of each trade choice and then leave it to you to follow up with more intense analysis. The first setup is for more conservative traders; consider selling an October 2009 $17.50 call at the same time you acquire 100 shares of CDE (Figure 3). The October $17.50 call is selling for about $3.50 (as of September 10, 2009), providing an annualized return -- if the shares are called away at October options expiration -- of about 38.90%. The second setup is also a covered call trade, this time using the October 2009 $20 call instead. This at-the-money covered call trade will yield about 85% annualized if the shares of CDE are called away at $20 on October 20, 2009. To manage each trade, decide upfront to risk no more than 1% to 2% of your account equity on each trade, being sure to give the trade some room to back and fill between now and October 20, 2009. Using a trendline or moving average trailing stop is one of the best ways to manage a covered call trade, so pull up some daily and weekly CDE charts and see what kinds of trendlines you can construct that might offer an intelligent way to close out a trade gone awry. |
Donald W. Pendergast is a financial markets consultant who offers specialized services to stock brokers and high net worth individuals who seek a better bottom line for their portfolios.
| Title: | Writer, market consultant |
| Company: | Linear Trading Systems LLC |
| Jacksonville, FL 32217 | |
| Phone # for sales: | 904-239-9564 |
| E-mail address: | lineartradingsys@gmail.com |
Traders' Resource Links | |
| Linear Trading Systems LLC has not added any product or service information to TRADERS' RESOURCE. | |
Click here for more information about our publications!
Comments
Date: 09/14/09Rank: 3Comment:

Request Information From Our Sponsors
- StockCharts.com, Inc.
- Candle Patterns
- Candlestick Charting Explained
- Intermarket Technical Analysis
- John Murphy on Chart Analysis
- John Murphy's Chart Pattern Recognition
- John Murphy's Market Message
- MurphyExplainsMarketAnalysis-Intermarket Analysis
- MurphyExplainsMarketAnalysis-Visual Analysis
- StockCharts.com
- Technical Analysis of the Financial Markets
- The Visual Investor
- VectorVest, Inc.
- Executive Premier Workshop
- One-Day Options Course
- OptionsPro
- Retirement Income Workshop
- Sure-Fire Trading Systems (VectorVest, Inc.)
- Trading as a Business Workshop
- VectorVest 7 EOD
- VectorVest 7 RealTime/IntraDay
- VectorVest AutoTester
- VectorVest Educational Services
- VectorVest OnLine
- VectorVest Options Analyzer
- VectorVest ProGraphics v6.0
- VectorVest ProTrader 7
- VectorVest RealTime Derby Tool
- VectorVest Simulator
- VectorVest Variator
- VectorVest Watchdog
