HOT TOPICS LIST
- MACD
- Fibonacci
- RSI
- Gann
- ADXR
- Stochastics
- Volume
- Triangles
- Futures
- Cycles
- Volatility
- ZIGZAG
- MESA
- Retracement
- Aroon
INDICATORS LIST
LIST OF TOPICS
PRINT THIS ARTICLE
by Chaitali Mohile
The light crude oil index has moved sideways after an exclusive advance rally. Let us check out the future stability of the consolidation range.
Position: N/A
Chaitali Mohile
Active trader in the Indian stock markets since 2003 and a full-time writer. Trading is largely based upon technical analysis.
PRINT THIS ARTICLE
CHART ANALYSIS
Crude Oil Index Is Under Pressure
09/09/09 11:14:45 AMby Chaitali Mohile
The light crude oil index has moved sideways after an exclusive advance rally. Let us check out the future stability of the consolidation range.
Position: N/A
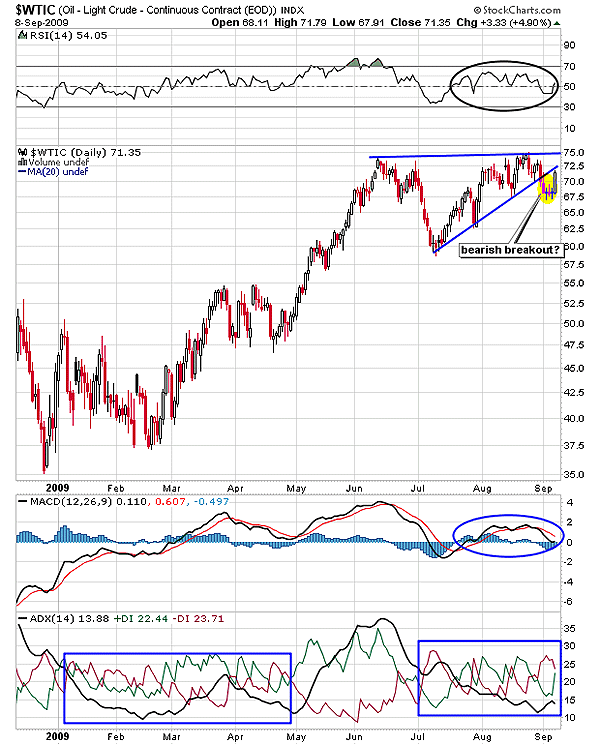
| In my June 17th article about light crude oil index ($WTIC), I mentioned the bearish target of $55 for the corrective rally from the $73 level. According to the daily chart in Figure 1, $WTIC made a low of $58.72 during the correction, proving my interpretation to be correct. Later, the index surged back to the previous resistance level of $73 and continued to move in a narrow range. In Figure 1, we can see a stable upper range at approximately $73/$75 and the higher lows formed a narrowing lower range. This particular sideways action formed a bullish flag & pennant pattern on the daily chart in Figure 1. |
| Traders usually stay on the sidelines during consolidation periods to protect their money. However, various buying and selling opportunities generated during the range-bound move of $WTIC must definitely have filled the pockets of traders. Earlier, the trading range within the flat upper range and the ascending lower range was wider, allowing safe entry-exit points. But due to a highly narrow range, $WTIC recently plunged below the lower trendline. |

|
| FIGURE 1: $WTIC, DAILY. The index has breached the lower trendline support. |
| Graphic provided by: StockCharts.com. |
| |
| We all know that the bullish flag & pennant breaks in an upward direction. However, the bullish continuation pattern in Figure 1 has breached downward. So should we consider this breakout as trend reversal, or should we watch the index movement for the next few days? September 8 was a big day for $WTIC, as it witnessed a robust bullish move of almost $2. In the yellow block in Figure 1, we can see a bearish candle with an upper shadow followed by a few dojis. This suggested a huge uncertainty among traders after an unpredictable bearish breakout. And along with the tapering price range, the weak average directional movement index (ADX) (14) resulted in the downward breakout. According to Figure 1, the equal buying and selling pressure has always remained a point of concern. The struggle between the buyers and sellers has added volatility in this sensitive commodity index. Currently, $WTIC is tangled in the same situation, resulting in the sudden bearish breakout. |

|
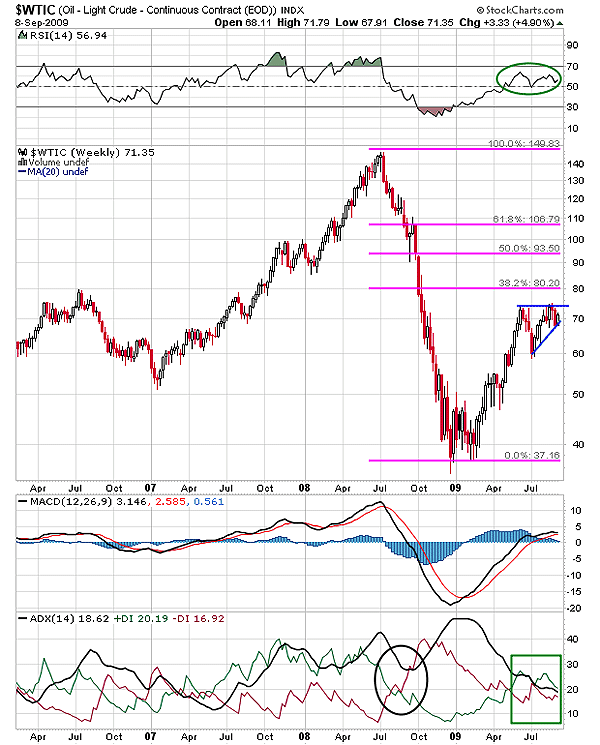
| FIGURE 2: $WTIC, WEEKLY. The 200-day MA and the Fibonacci retracement level of 38.2% are the major hurdles for the future breakout rally. |
| Graphic provided by: StockCharts.com. |
| |
| The relative strength index (RSI) (14) is ready to establish the support at 50 levels, regaining the bullish confidence in the rally. In addition, the moving average convergence/divergence (MACD) (12,26,9) has sustained above the zero line in positive territory. Therefore, $WTIC is likely to convert the freshly formed lower trendline resistance to support and continue its range-bound rally. Since the range would be very narrow, trading within the two trendlines might become risky. So I would recommend low-volume trading during the period. For the next few months, the volatile is bound to increase due to the narrow range and the various long-term resistances that would challenge the bullish breakout of the pattern. |

|
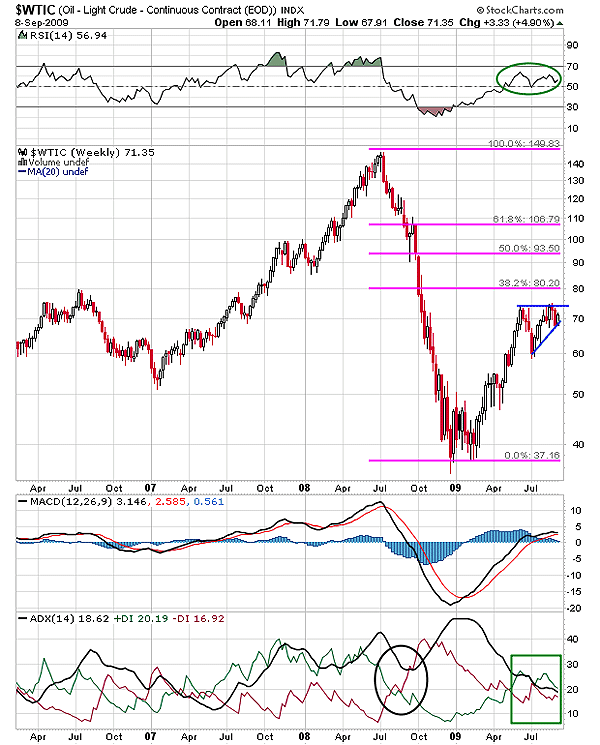
| FIGURE 3: $WTIC, WEEKLY. The chart with 10 years' data shows the trendline resistance, which is likely to restrict the bullish rally. This trendline is the long-term resistance for the index. |
| Graphic provided by: StockCharts.com. |
| |
| The bullish flag & pennant is visible on our weekly chart in Figure 2 as well. The stock is consolidating under the resistance of the 200-day moving average (MA) resistance. The $WTIC in Figure 2 is still within the consolidation range as the lower trendline support is marginally lower than the one in the daily time frame. In my earlier article, two resistances were highlighted on the weekly time frame: the 200-day MA and the trendline. Currently, the long-term MA resistance is restricting the bullish breakout of the flag & pennant (Figure 3). If the pattern undergoes the breakout in the near future, then the Fibonacci retracement level at $80.20 and the trendline resistance would restrict the rally. The RSI (14) has strong support at the 50 level and the MACD (12,26,9) has slipped in positive territory. In addition, the buying pressure indicated by the positive directional index (+DI) is building up although the ADX (14) is weak. Therefore, $WTIC is likely to move in the narrow range during the consolidation until some strong momentum pours in. |
Active trader in the Indian stock markets since 2003 and a full-time writer. Trading is largely based upon technical analysis.
| Company: | Independent |
| Address: | C1/3 Parth Indraprasth Towers. Vastrapur |
| Ahmedabad, Guj 380015 | |
| E-mail address: | chaitalimohile@yahoo.co.in |
Traders' Resource Links | |
| Independent has not added any product or service information to TRADERS' RESOURCE. | |
Click here for more information about our publications!
Comments
Date: 09/09/09Rank: 5Comment:
Date: 09/09/09Rank: 2Comment:

Request Information From Our Sponsors
- StockCharts.com, Inc.
- Candle Patterns
- Candlestick Charting Explained
- Intermarket Technical Analysis
- John Murphy on Chart Analysis
- John Murphy's Chart Pattern Recognition
- John Murphy's Market Message
- MurphyExplainsMarketAnalysis-Intermarket Analysis
- MurphyExplainsMarketAnalysis-Visual Analysis
- StockCharts.com
- Technical Analysis of the Financial Markets
- The Visual Investor
- VectorVest, Inc.
- Executive Premier Workshop
- One-Day Options Course
- OptionsPro
- Retirement Income Workshop
- Sure-Fire Trading Systems (VectorVest, Inc.)
- Trading as a Business Workshop
- VectorVest 7 EOD
- VectorVest 7 RealTime/IntraDay
- VectorVest AutoTester
- VectorVest Educational Services
- VectorVest OnLine
- VectorVest Options Analyzer
- VectorVest ProGraphics v6.0
- VectorVest ProTrader 7
- VectorVest RealTime Derby Tool
- VectorVest Simulator
- VectorVest Variator
- VectorVest Watchdog
