HOT TOPICS LIST
- MACD
- Fibonacci
- RSI
- Gann
- ADXR
- Stochastics
- Volume
- Triangles
- Futures
- Cycles
- Volatility
- ZIGZAG
- MESA
- Retracement
- Aroon
INDICATORS LIST
LIST OF TOPICS
PRINT THIS ARTICLE
by Ron Walker
In recent years contrarian indicators have become increasingly popular with traders, but the Arms index stands out as one of the favorites. Knowing how to interpret the index correctly can help provide a trader with timely entry and exit points.
Position: N/A
Ron Walker
Ron Walker is an active trader and technical analyst. He operates an educational website dedicated to the study of Technical Analysis. The website offers free market analysis with daily video presentations and written commentaries. Ron is a video pioneer, being one of the first to utilize the internet producing Technical Analysis videos. His website is thechartpatterntrader.com
PRINT THIS ARTICLE
ARMS INDEX
TRIN, The Contrarian Indicator
09/09/09 08:23:20 AMby Ron Walker
In recent years contrarian indicators have become increasingly popular with traders, but the Arms index stands out as one of the favorites. Knowing how to interpret the index correctly can help provide a trader with timely entry and exit points.
Position: N/A
| The Arms index is named after its creator, Richard Arms. It is also called the short-term trading index, or TRIN for short. TRIN is a contrarian indicator that has an inverse relationship with the stock market that helps determine if there is greater volume in rising stocks or declining stocks. The purpose of TRIN is to determine what actually controls the market. |
| TRIN is calculated taking the number of advancing issues and dividing it by the number of declining issues. This ratio is the numerator in the Arms calculation. The denominator is determined by taking advancing volume and dividing it by the declining volume. The formula is simple: (Advancing issues/declining issues) divided by (Advancing volume/declining volume issues) TRIN is the advance/decline ratio divided by the advancing volume/declining volume ratio. |
| TRIN generates signals when the market is overbought or oversold. A rising TRIN is bearish and lets us know that sellers are in control of the market, while a falling TRIN is bullish and lets us know that buyers are in control. Readings above and below 1.0 offer even more information. Readings below 1.0 is positive and indicates that the majority of volume is pumping into advancing issues, showing that buyers are in control. When the TRIN is above 1.0, it reflects that volume on declining issues is outpacing advancing issues, putting sellers in control of the market. This is a negative sign. The TRIN indicator lets you know whether the bulls or bears are currently in power, helping a trader fine-tune entry and exit points. Divergences between the NYSE and TRIN can also form, giving additional clues of market direction. |

|
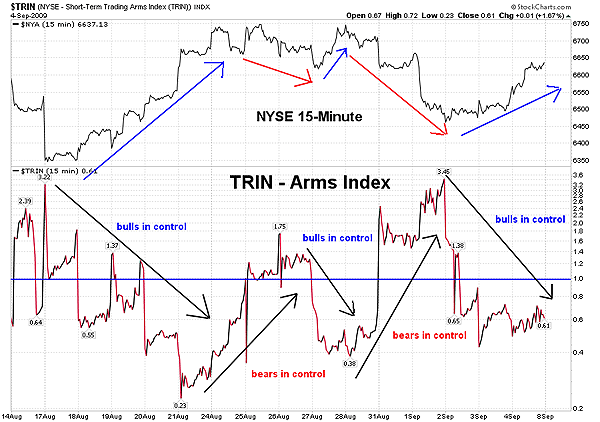
| FIGURE 1: NYSE 15-MINUTE VS. TRIN. TRIN is used to determine market control. When TRIN is rising it is considered bearish, while a falling TRIN is considered bullish. Note the arrows between the NYSE and TRIN point in opposite directions. A reading below 1.0 indicates buyers are in control, while readings above 1.0 indicate that sellers are in control. |
| Graphic provided by: StockCharts.com. |
| |
| Figure 1 displays TRIN in the 15-minute time frame. The upper window shows the New York Stock Exchange index (NYSE) in that same time frame. When an extremely high reading occurs on TRIN in the intraday time frame it is considered positive, and when a low reading occurs it is considered to be negative for the stock market. Why? Because when TRIN peaks at extremes, then turns and starts to decline, the market is likely rising. In contrast, when TRIN makes an extreme low, bottoms, then turns and begins to rise, the stock market will begin falling. Note how the trendlines on TRIN move in the opposite direction of those on NYSE in the 15-minute time frame (Figure 1). |

|
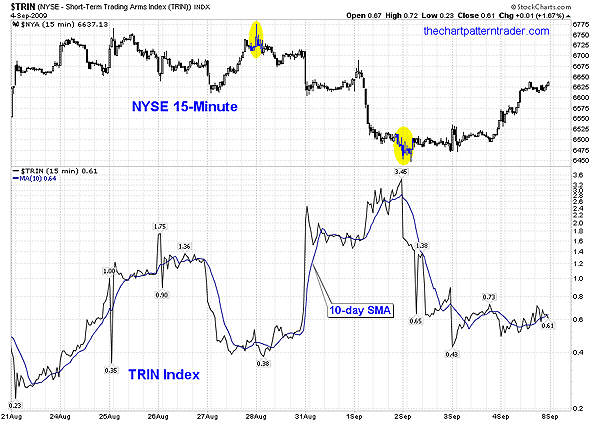
| FIGURE 2: NYSE 15-MINUTE VS. TRIN. Applying a 10-day simple moving average to TRIN helps smooth out the indicator. The market is considered overbought when the 10-day SMA of the TRIN is below 0.8 and oversold when the TRIN is above 1.2. |
| Graphic provided by: StockCharts.com. |
| |
| TRIN is highly volatile and can be smoothed out with moving averages. Richard Arms uses the 10-day simple moving average (SMA) in order to determine overbought and oversold conditions. He considers the market overbought when the 10-day SMA of the TRIN is below 0.8 and oversold when the TRIN is above 1.2. Using this methodology isn't always perfect, and it doesn't always work out. That's why TRIN should be used with other indicators to help a trader determine overbought and oversold conditions. In Figure 2 you can see the TRIN in the 15-minute again (the lower window of the chart), but this time I have added the 10-day SMA. Note how most of the time TRIN moves above its 10-day SMA when the NYSE is falling. Remember, the 10-day SMA is added to help determine overbought and oversold conditions. So when the 10-day simple moving average is rising, the market is declining and sellers are in control. A falling 10-day SMA puts buyers in the driver's seat and the market should be rising. TRIN is most valuable when applied to intraday time frames. |
Ron Walker is an active trader and technical analyst. He operates an educational website dedicated to the study of Technical Analysis. The website offers free market analysis with daily video presentations and written commentaries. Ron is a video pioneer, being one of the first to utilize the internet producing Technical Analysis videos. His website is thechartpatterntrader.com
| Website: | thechartpatterntrader.com |
| E-mail address: | thechartpatterntrader@gmail.com |
Click here for more information about our publications!
Comments

Request Information From Our Sponsors
- VectorVest, Inc.
- Executive Premier Workshop
- One-Day Options Course
- OptionsPro
- Retirement Income Workshop
- Sure-Fire Trading Systems (VectorVest, Inc.)
- Trading as a Business Workshop
- VectorVest 7 EOD
- VectorVest 7 RealTime/IntraDay
- VectorVest AutoTester
- VectorVest Educational Services
- VectorVest OnLine
- VectorVest Options Analyzer
- VectorVest ProGraphics v6.0
- VectorVest ProTrader 7
- VectorVest RealTime Derby Tool
- VectorVest Simulator
- VectorVest Variator
- VectorVest Watchdog
- StockCharts.com, Inc.
- Candle Patterns
- Candlestick Charting Explained
- Intermarket Technical Analysis
- John Murphy on Chart Analysis
- John Murphy's Chart Pattern Recognition
- John Murphy's Market Message
- MurphyExplainsMarketAnalysis-Intermarket Analysis
- MurphyExplainsMarketAnalysis-Visual Analysis
- StockCharts.com
- Technical Analysis of the Financial Markets
- The Visual Investor
