HOT TOPICS LIST
- MACD
- Fibonacci
- RSI
- Gann
- ADXR
- Stochastics
- Volume
- Triangles
- Futures
- Cycles
- Volatility
- ZIGZAG
- MESA
- Retracement
- Aroon
INDICATORS LIST
LIST OF TOPICS
PRINT THIS ARTICLE
by Koos van der Merwe
School holidays are over. September, traditionally the quietest month of the year, is upon us, with the notoriously volatile October ahead. What now?
Position: Accumulate
Koos van der Merwe
Has been a technical analyst since 1969, and has worked as a futures and options trader with First Financial Futures in Johannesburg, South Africa.
PRINT THIS ARTICLE
ELLIOTT WAVE
Vacation Time Is Over. What Now?
09/08/09 11:14:59 AMby Koos van der Merwe
School holidays are over. September, traditionally the quietest month of the year, is upon us, with the notoriously volatile October ahead. What now?
Position: Accumulate
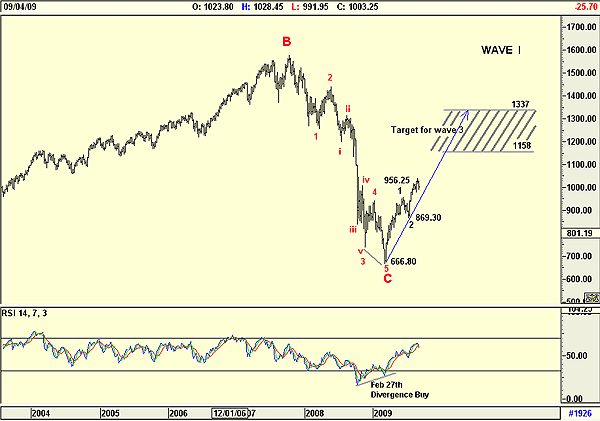
| Figure 1 is a weekly chart of the Standard & Poor's 500. In the chart I have shown my preferred Elliott wave count, which suggests that the index is presently tracing a wave I upward in a new bull market. In the chart, note the following: |

|
| FIGURE 1: SPX, WEEKLY |
| Graphic provided by: AdvancedGET. |
| |
| -The relative strength index (RSI) gave a divergence buy signal on February 27, 2009. This is a strong buy signal and the index moved up strongly. -The chart shows that wave 2 of wave I is complete, and the index is currently in wave 3 of wave I. -The move from a low of 666.80 to a high of 956.25 in wave 1 of wave I suggests that the top of wave 3 of wave I should be anywhere between 1158 and 1137. Wave 3s are usually 1.618 the length of wave 1. They can also be equal to wave 1, but should never be less. If, and this happens rarely, they are less than wave 1, then wave 5 will be shorter than wave 3. -Wave 2 of wave I is a simple wave, which means that wave 4 of wave I will be a complicated wave. The chart suggests that there will be no dramatic September down move and no October crash, unless of course September turns out to be a nonquiet month contrary to the norm, as traders and investors returning from vacation rush into the market and push the index to the suggested target far quicker than expected. Should this happen, then we could easily see a wave 4 in October with a wave 5 of wave I sometime in 2010. Vacation is over. The next few weeks should be interesting. |
Has been a technical analyst since 1969, and has worked as a futures and options trader with First Financial Futures in Johannesburg, South Africa.
| Address: | 3256 West 24th Ave |
| Vancouver, BC | |
| Phone # for sales: | 6042634214 |
| E-mail address: | petroosp@gmail.com |
Click here for more information about our publications!
Comments
Date: 09/08/09Rank: 3Comment:

Request Information From Our Sponsors
- StockCharts.com, Inc.
- Candle Patterns
- Candlestick Charting Explained
- Intermarket Technical Analysis
- John Murphy on Chart Analysis
- John Murphy's Chart Pattern Recognition
- John Murphy's Market Message
- MurphyExplainsMarketAnalysis-Intermarket Analysis
- MurphyExplainsMarketAnalysis-Visual Analysis
- StockCharts.com
- Technical Analysis of the Financial Markets
- The Visual Investor
- VectorVest, Inc.
- Executive Premier Workshop
- One-Day Options Course
- OptionsPro
- Retirement Income Workshop
- Sure-Fire Trading Systems (VectorVest, Inc.)
- Trading as a Business Workshop
- VectorVest 7 EOD
- VectorVest 7 RealTime/IntraDay
- VectorVest AutoTester
- VectorVest Educational Services
- VectorVest OnLine
- VectorVest Options Analyzer
- VectorVest ProGraphics v6.0
- VectorVest ProTrader 7
- VectorVest RealTime Derby Tool
- VectorVest Simulator
- VectorVest Variator
- VectorVest Watchdog
