HOT TOPICS LIST
- MACD
- Fibonacci
- RSI
- Gann
- ADXR
- Stochastics
- Volume
- Triangles
- Futures
- Cycles
- Volatility
- ZIGZAG
- MESA
- Retracement
- Aroon
INDICATORS LIST
LIST OF TOPICS
PRINT THIS ARTICLE
by Donald W. Pendergast, Jr.
When the same trading system issues simultaneous buy signals on the same stock in three separate time frames, something big may be about to happen.
Position: Accumulate
Donald W. Pendergast, Jr.
Donald W. Pendergast is a financial markets consultant who offers specialized services to stock brokers and high net worth individuals who seek a better bottom line for their portfolios.
PRINT THIS ARTICLE
TRADING SYSTEMS
General Dynamics Bullish On Three Fronts
09/08/09 11:10:00 AMby Donald W. Pendergast, Jr.
When the same trading system issues simultaneous buy signals on the same stock in three separate time frames, something big may be about to happen.
Position: Accumulate
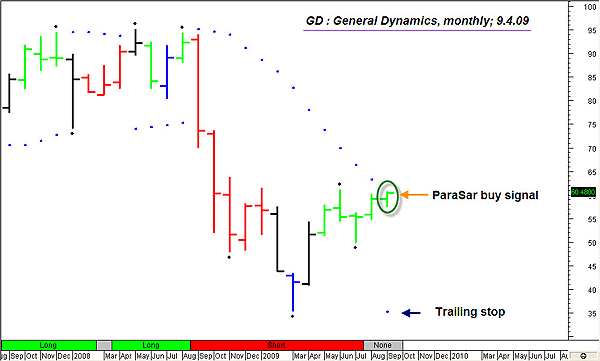
| Professional traders use a variety of means to confirm a given trade entry signal, and using multiple time-frame analysis is one of the better ways to accomplish this. General Dynamics (GD) stock is in the enviable position of having three fresh buy signals (within the past two weeks) across three different time frames, according to the parabolic stop and reverse system's criteria. We'll start with the monthly chart of GD (Figure 1) and work our way down to the lower time frames from there. |

|
| FIGURE 1: GD, MONTHLY. Here's a hopeful sign for long-term holders of GD; a fresh monthly ParaSar buy setup appears. This is also powerful technical confirmation for those trading long on the weekly and daily time frames. |
| Graphic provided by: MetaStock. |
| Graphic provided by: Bill WIlliams - Profitunity MetaStock Expert Advis. |
| |
| Very simple and sweet: here's a new monthly ParaSar buy signal on GD. Mind you, the idea isn't to actually trade this monthly signal, but rather to help give us extra confidence to take the buy signals that have recently printed on the weekly and daily time frames. |

|
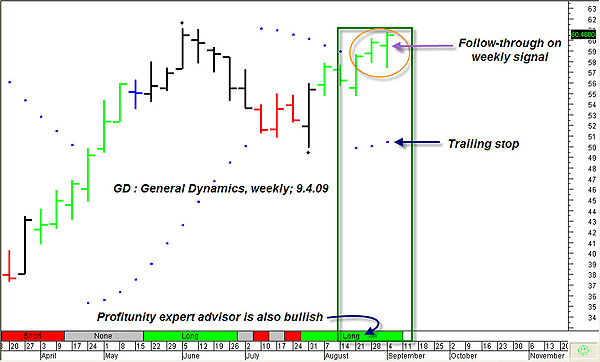
| FIGURE 2: GD, WEEKLY. Yet again, ParaSar is long, this time on GD's weekly chart. Given the bullish monthly momentum, placing an October 2009 GD $60 covered call trade might be a low-risk endeavor. |
| Graphic provided by: MetaStock. |
| Graphic provided by: Bill WIlliams - Profitunity MetaStock Expert Advis. |
| |
| Figure 2 is the weekly chart. Although this ParaSar signal is two weeks old, the good news is that it has had decent follow-through, thus confirming the validity of the signal. In addition, Bill Williams' Profitunity expert advisor (the green ribbon at the bottom of chart) is also suggesting that long is the way to go. |

|
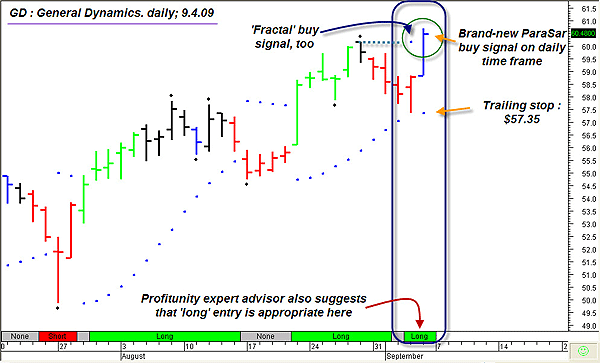
| FIGURE 3: GD, DAILY. Incredibly, ParaSar is also long on GD's daily chart. With solid weekly and monthly momentum working in its favor, taking this daily buy signal appears to be a very low-risk proposition. |
| Graphic provided by: Bill WIlliams - Profitunity MetaStock Expert Advis. |
| |
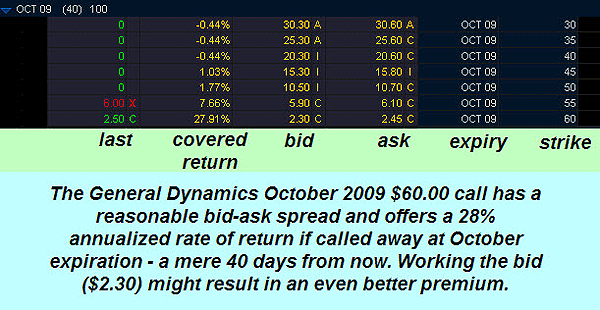
| Finally, we examine GD's daily chart (Figure 3). Again, there's a new ParaSar buy signal, complete with a Profitunity long confirming signal. Also note that when the previous swing high at $60.17 was exceeded, a valid fractal buy signal occurred. This looks like a very strong trade setup for daily traders, especially since GD also appears to be all systems go (literally) on its weekly and monthly time frames as well. If going long on this daily signal, simply buy at the next open -- Tuesday, September 8, 2009 -- and then immediately place a trailing stop at $57.35 (blue dot on chart). Adjust the stop in your trading account daily according to the new ParaSar dots that appear and then let the trade play out. Weekly traders might also consider putting on a GD covered call trade, counting on the stock's strong monthly momentum to provide solid carrying power until the October option expiration (October 16, 2009). Figure 4 depicts Friday's closing prices for various October 2009 GD calls; the most attractive covered call play appears to be offered by selling one October $60 call (option ticker GDJL) for every 100 shares of GD purchased. At Friday's closing prices, such a trade would yield about 28% annualized if the shares were called away at expiration on October 16, 2009. To manage this covered call trade, consider using a two-bar trailing stop of the weekly lows; a weekly close below the stop will be your "get out" signal to abandon the trade and move on to greener pastures. |

|
| FIGURE 4: GD CALL. Checking the bid-ask spread, volume, open interest, and implied volatility of the options you desire to sell is a must. Using a professional-quality option analysis platform can make your job that much easier. |
| Graphic provided by: ThinkorSwim; GD option quotes. |
| |
| Ultimately, it's your call. Either go with what appears to be a very low-risk daily trade in GD or run with a mellow October covered call setup. Since we are in a generally turbulent season in the stock market (September/October), it might pay to be a little more conservative with your trade sizing or dollar allocations should you decide to go ahead with either of these two opportunities. |
Donald W. Pendergast is a financial markets consultant who offers specialized services to stock brokers and high net worth individuals who seek a better bottom line for their portfolios.
| Title: | Writer, market consultant |
| Company: | Linear Trading Systems LLC |
| Jacksonville, FL 32217 | |
| Phone # for sales: | 904-239-9564 |
| E-mail address: | lineartradingsys@gmail.com |
Traders' Resource Links | |
| Linear Trading Systems LLC has not added any product or service information to TRADERS' RESOURCE. | |
Click here for more information about our publications!
Comments
Date: 09/08/09Rank: 5Comment:

Request Information From Our Sponsors
- StockCharts.com, Inc.
- Candle Patterns
- Candlestick Charting Explained
- Intermarket Technical Analysis
- John Murphy on Chart Analysis
- John Murphy's Chart Pattern Recognition
- John Murphy's Market Message
- MurphyExplainsMarketAnalysis-Intermarket Analysis
- MurphyExplainsMarketAnalysis-Visual Analysis
- StockCharts.com
- Technical Analysis of the Financial Markets
- The Visual Investor
- VectorVest, Inc.
- Executive Premier Workshop
- One-Day Options Course
- OptionsPro
- Retirement Income Workshop
- Sure-Fire Trading Systems (VectorVest, Inc.)
- Trading as a Business Workshop
- VectorVest 7 EOD
- VectorVest 7 RealTime/IntraDay
- VectorVest AutoTester
- VectorVest Educational Services
- VectorVest OnLine
- VectorVest Options Analyzer
- VectorVest ProGraphics v6.0
- VectorVest ProTrader 7
- VectorVest RealTime Derby Tool
- VectorVest Simulator
- VectorVest Variator
- VectorVest Watchdog
