HOT TOPICS LIST
- MACD
- Fibonacci
- RSI
- Gann
- ADXR
- Stochastics
- Volume
- Triangles
- Futures
- Cycles
- Volatility
- ZIGZAG
- MESA
- Retracement
- Aroon
INDICATORS LIST
LIST OF TOPICS
PRINT THIS ARTICLE
by David Penn
What started as a diamond bottom reversal has begun to retrace as quickly as it broke out.
Position: N/A
David Penn
Technical Writer for Technical Analysis of STOCKS & COMMODITIES magazine, Working-Money.com, and Traders.com Advantage.
PRINT THIS ARTICLE
TECHNICAL ANALYSIS
The December Dollar's Diamond Bottom: Pullback or Failure?
10/15/01 08:58:49 AMby David Penn
What started as a diamond bottom reversal has begun to retrace as quickly as it broke out.
Position: N/A
| As the economy slowed and the stock market began its early autumn decline, talk about the dangerous strength of the U.S. dollar became more and more commonplace. While there was no consensus on whether or not the strong dollar that had buoyed the market boom was the same strong dollar that was now holding back the economy, there was a sense that the increased liquidity brought on by the Federal Reserve Board's interest rate cutting campaign of 2001 was sure to result in a weaker greenback. |
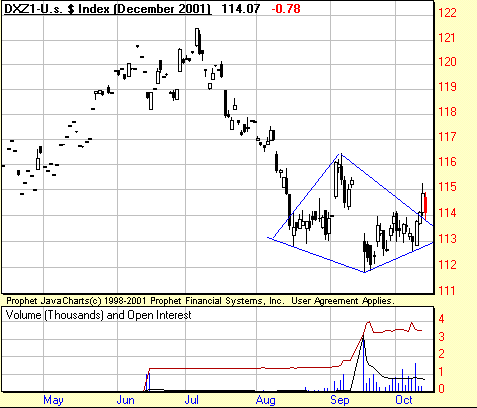
| This is represented well in the decline in the December dollar after reaching a peak of about 121.25 early in July. From that point, the greenback lost seven percent of its value in about a month, reaching a temporary bottom of 113 in early August. A potentially bullish breakout from an August trading range occurred at the beginning of September. But a few short days into the month, the shock of the terrorist attack sent the greenback to new lows--dropping 2% on major volume from the date of the attack to the day the dollar began trading again. |

|
| Up to 118, mired between 113 and 114, or down as low as 109? The pullback from this breakout suggests any one of three possibilities for the December greenback. |
| Graphic provided by: Prophet Finance. |
| |
| The rally from this most recent low and subsequent consolidation range helped finish off what might have appeared to be a diamond bottom. Diamond bottoms are formed by prices that initially trade in a tight range that expands to mark both higher highs and lower lows. After this expansion, price ranges again retract. As bottoms, these formations develop generally during significant downtrends, and are considered to be relatively reliable reversal patterns. True enough, the December greenback broke out of both the trading range that formed the right side of the diamond, as well as the diamond pattern itself on October 10th and 11th, suggesting perhaps that the decline had ended and that the dollar was on its way back up. |
| However, as of Friday the 12th, the dollar had given up all of its breakout gains, pulling back for an intraday touch of the downward trendline that marks the right side of the diamond (see chart). As long as that particular trendline holds, then the possibility that the December greenback is undergoing a pullback--as opposed to suffering a pattern breakout failure--remains intact. With regard to the possibility of failure, it is worth noting the significant support that the 113 level is likely to provide. Save for the sell-off low when the markets reopened after the September 11th attacks, the dollar has managed to hold above 113 fairly well. This location of support at the bottom of diamond bottom pattern is common--the reverse is the case, for example, with diamond tops, where resistance is found at the top. |
| The measurement rule for diamond patterns takes the size of the formation and adds that amount to the value at the point of the breakout. With a breakout on October 10th and 11th at 114, and a formation height of approximately four, an upside target of 118 could be expected should the breakout hold and the pullback turn out to be nothing more than an opportunity to buy. |
Technical Writer for Technical Analysis of STOCKS & COMMODITIES magazine, Working-Money.com, and Traders.com Advantage.
| Title: | Technical Writer |
| Company: | Technical Analysis, Inc. |
| Address: | 4757 California Avenue SW |
| Seattle, WA 98116 | |
| Phone # for sales: | 206 938 0570 |
| Fax: | 206 938 1307 |
| Website: | www.Traders.com |
| E-mail address: | DPenn@traders.com |
Traders' Resource Links | |
| Charting the Stock Market: The Wyckoff Method -- Books | |
| Working-Money.com -- Online Trading Services | |
| Traders.com Advantage -- Online Trading Services | |
| Technical Analysis of Stocks & Commodities -- Publications and Newsletters | |
| Working Money, at Working-Money.com -- Publications and Newsletters | |
| Traders.com Advantage -- Publications and Newsletters | |
| Professional Traders Starter Kit -- Software | |
Click here for more information about our publications!
Comments
Date: 10/16/01Rank: 5Comment:

Request Information From Our Sponsors
- VectorVest, Inc.
- Executive Premier Workshop
- One-Day Options Course
- OptionsPro
- Retirement Income Workshop
- Sure-Fire Trading Systems (VectorVest, Inc.)
- Trading as a Business Workshop
- VectorVest 7 EOD
- VectorVest 7 RealTime/IntraDay
- VectorVest AutoTester
- VectorVest Educational Services
- VectorVest OnLine
- VectorVest Options Analyzer
- VectorVest ProGraphics v6.0
- VectorVest ProTrader 7
- VectorVest RealTime Derby Tool
- VectorVest Simulator
- VectorVest Variator
- VectorVest Watchdog
- StockCharts.com, Inc.
- Candle Patterns
- Candlestick Charting Explained
- Intermarket Technical Analysis
- John Murphy on Chart Analysis
- John Murphy's Chart Pattern Recognition
- John Murphy's Market Message
- MurphyExplainsMarketAnalysis-Intermarket Analysis
- MurphyExplainsMarketAnalysis-Visual Analysis
- StockCharts.com
- Technical Analysis of the Financial Markets
- The Visual Investor
