HOT TOPICS LIST
- MACD
- Fibonacci
- RSI
- Gann
- ADXR
- Stochastics
- Volume
- Triangles
- Futures
- Cycles
- Volatility
- ZIGZAG
- MESA
- Retracement
- Aroon
INDICATORS LIST
LIST OF TOPICS
PRINT THIS ARTICLE
by Chaitali Mohile
The Gold Index has veered downward in a narrow range over the past few months. The bullish breakout has brought back the lost glitter of the precious metal. How long can we stay positioned on gold?
Position: Buy
Chaitali Mohile
Active trader in the Indian stock markets since 2003 and a full-time writer. Trading is largely based upon technical analysis.
PRINT THIS ARTICLE
BREAKOUTS
Gold Breaks Upward
09/04/09 08:54:47 AMby Chaitali Mohile
The Gold Index has veered downward in a narrow range over the past few months. The bullish breakout has brought back the lost glitter of the precious metal. How long can we stay positioned on gold?
Position: Buy
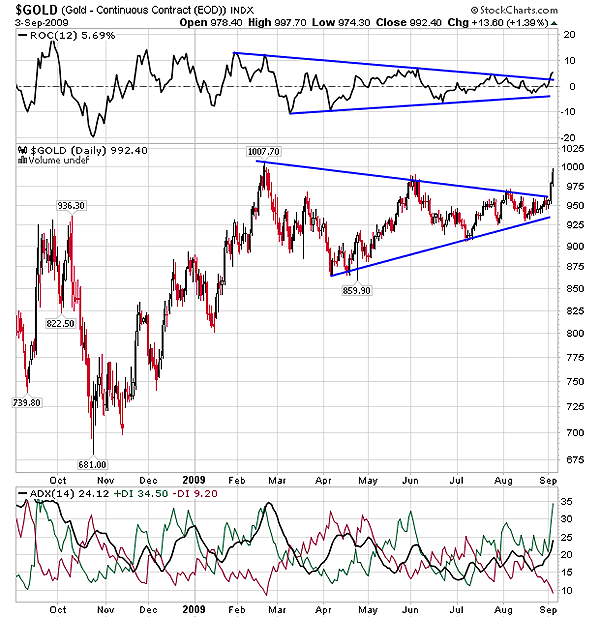
| In Figure 1, the gold continuous contract ($GOLD) made lower peaks from 1007 levels and formed consecutive higher bottoms. The range for $GOLD narrowed even more, forming a symmetrical triangle pattern on its daily chart. When upper and lower trendlines converge, a symmetrical triangle appears on the chart. Due to the converging trendline, identifying the breakout direction is very difficult. This triangle is the continuous pattern in an uptrend as well as in a downtrend. These are some important features that differentiate the symmetrical triangle from ascending and descending triangle patterns. |
| The narrowing range induced high volatility in $GOLD. The equal buying and selling pressure indicated by the average directional movement index (ADX) (14) reflects the volatility in the index. As a result, the ADX (14) was unable to sustain above one particular level (see Figure 1). The rate of change (ROC)(14) also formed the symmetrical triangle in the past few days. After the recent bullish breakout, $GOLD's direction is clear and has opened a fresh buying opportunity. Along with the price breakout, the ROC (14) has surged and the ADX (14) indicated a developing uptrend. Therefore, traders can trigger long positions for an intermediate term. |

|
| FIGURE 1: $GOLD, DAILY. The symmetrical triangle has breached upward. The resistance at 1007 and 1033 would act as the intermediate- and the short-term target, respectively. However, the potential target of the symmetrical triangle breakout would be the long-term target. |
| Graphic provided by: StockCharts.com. |
| |
| Since the breakout has moved $52, I would watch the previous high at 1007 as an intermediate target. As such, the potential target on the symmetrical triangle is measured by adding the length of the triangle to the breakout level. Thus, the minimum estimated level after a breakout would be 1007 - 860 = 147 + 950 = 1097. But this level could be observed as a long-term target for $GOLD. After 1007, the second resistance is the 1033 level, which might suppress the breakout rally, leading to either consolidation or a short-term correction. |
| Therefore, traders can set up a buy with the intermediate target of 1007 and a short-term target of 1033. |
Active trader in the Indian stock markets since 2003 and a full-time writer. Trading is largely based upon technical analysis.
| Company: | Independent |
| Address: | C1/3 Parth Indraprasth Towers. Vastrapur |
| Ahmedabad, Guj 380015 | |
| E-mail address: | chaitalimohile@yahoo.co.in |
Traders' Resource Links | |
| Independent has not added any product or service information to TRADERS' RESOURCE. | |
Click here for more information about our publications!
Comments
Date: 09/08/09Rank: 1Comment:

Request Information From Our Sponsors
- StockCharts.com, Inc.
- Candle Patterns
- Candlestick Charting Explained
- Intermarket Technical Analysis
- John Murphy on Chart Analysis
- John Murphy's Chart Pattern Recognition
- John Murphy's Market Message
- MurphyExplainsMarketAnalysis-Intermarket Analysis
- MurphyExplainsMarketAnalysis-Visual Analysis
- StockCharts.com
- Technical Analysis of the Financial Markets
- The Visual Investor
- VectorVest, Inc.
- Executive Premier Workshop
- One-Day Options Course
- OptionsPro
- Retirement Income Workshop
- Sure-Fire Trading Systems (VectorVest, Inc.)
- Trading as a Business Workshop
- VectorVest 7 EOD
- VectorVest 7 RealTime/IntraDay
- VectorVest AutoTester
- VectorVest Educational Services
- VectorVest OnLine
- VectorVest Options Analyzer
- VectorVest ProGraphics v6.0
- VectorVest ProTrader 7
- VectorVest RealTime Derby Tool
- VectorVest Simulator
- VectorVest Variator
- VectorVest Watchdog
