HOT TOPICS LIST
- MACD
- Fibonacci
- RSI
- Gann
- ADXR
- Stochastics
- Volume
- Triangles
- Futures
- Cycles
- Volatility
- ZIGZAG
- MESA
- Retracement
- Aroon
INDICATORS LIST
LIST OF TOPICS
PRINT THIS ARTICLE
by Chaitali Mohile
The short-term bearish reversal formation of the Consumer Discretionary SPDR is likely to affect one of the sector's strong stocks. Let's go through the trading strategy for the particular stock as well as the index.
Position: N/A
Chaitali Mohile
Active trader in the Indian stock markets since 2003 and a full-time writer. Trading is largely based upon technical analysis.
PRINT THIS ARTICLE
REVERSAL
Tiffany Gap Up
09/03/09 10:13:18 AMby Chaitali Mohile
The short-term bearish reversal formation of the Consumer Discretionary SPDR is likely to affect one of the sector's strong stocks. Let's go through the trading strategy for the particular stock as well as the index.
Position: N/A
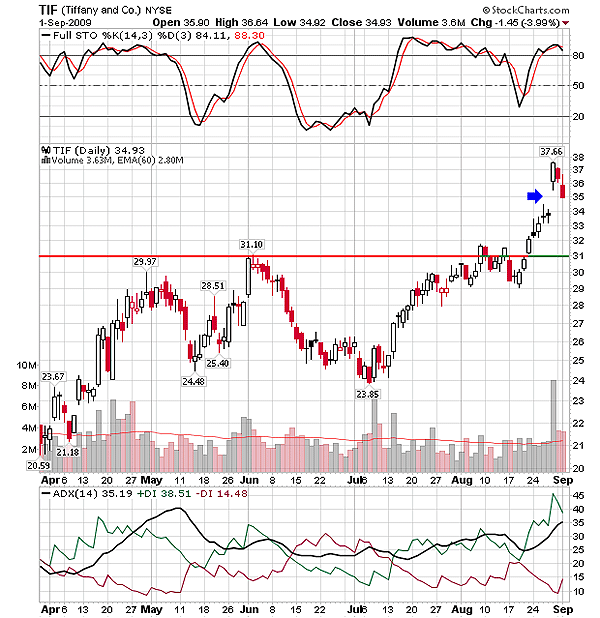
| An uptrend for Tiffany and Co. (TIF) turned stronger with the resistance breakout at $31. The support-resistance tool in Figure 1 shows that the resistance level was challenged twice before actually breaching it. Finally, during the third attempt TIF struggled hard near the $31 level and consolidated under the resistance. This consolidation accumulated the bullish strength that resulted in a robust breakout of the stock. The bullish rally continued on positive notes by the full stochastic (14,3,3) and the developing uptrend indicated by the average directional movement index (ADX) (14). |

|
| FIGURE 1: TIF, DAILY. The stock is correcting after hitting the 52-week high. The bearish rally is likely to fill the gap completely and would open fresh buying opportunities for the traders. |
| Graphic provided by: StockCharts.com. |
| |
| A gap up opening in Figure 1 was a boon as TIF hit a 52-week high at $37.66. Here, two events occurred simultaneously -- the gap up opening and the 52-week high. Usually, the stock or an index retraces back to previous support after both the events. We can see in Figure 1 that TIF has already turned down and is in process of gap filling. The stochastic oscillator is ready to decline from an overbought level, indicating some more downside rally for TIF. |

|
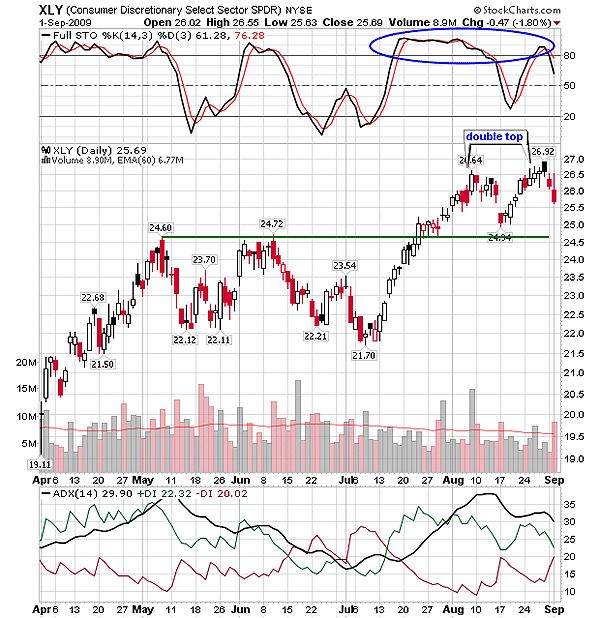
| FIGURE 2: XLY, DAILY. The double-top formation in XLY has resulted in downside price action. |
| Graphic provided by: StockCharts.com. |
| |
| TIF belongs to the Consumer Discretionary Sector (XLY). Recently, XLY formed a short-term double top -- a bearish reversal formation on its daily chart in Figure 2. The sector index lost $2 from the top at $26. The ADX (14) is descending from overheated uptrend levels, resulting in the bearish rally. However, the uptrend would sustain till the ADX (14) is above 20 levels. Due to the current uptrend, XLY is likely to find support at $24.50 and prevent additional loss. |
| But the ongoing rally toward the $24.50 level would have adverse effect on TIF. As a result, the gap would be filled and the stock might hit the previous low. Since the long-term uptrend for XLY is well placed, the sector would carry its kids safely. Therefore, we can take long position on TIF as the gap is filled or near the support at $31. Traders should also remember that the reversal point of the full stochastic (14,3,3) can also be a good buying level for TIF. Those interested in sector trading can set up a buy near the $24.50 or as the stochastic oscillator (14,3,3) in Figure 2 establishes support at the 50 level. |
Active trader in the Indian stock markets since 2003 and a full-time writer. Trading is largely based upon technical analysis.
| Company: | Independent |
| Address: | C1/3 Parth Indraprasth Towers. Vastrapur |
| Ahmedabad, Guj 380015 | |
| E-mail address: | chaitalimohile@yahoo.co.in |
Traders' Resource Links | |
| Independent has not added any product or service information to TRADERS' RESOURCE. | |
Click here for more information about our publications!
PRINT THIS ARTICLE

Request Information From Our Sponsors
- StockCharts.com, Inc.
- Candle Patterns
- Candlestick Charting Explained
- Intermarket Technical Analysis
- John Murphy on Chart Analysis
- John Murphy's Chart Pattern Recognition
- John Murphy's Market Message
- MurphyExplainsMarketAnalysis-Intermarket Analysis
- MurphyExplainsMarketAnalysis-Visual Analysis
- StockCharts.com
- Technical Analysis of the Financial Markets
- The Visual Investor
- VectorVest, Inc.
- Executive Premier Workshop
- One-Day Options Course
- OptionsPro
- Retirement Income Workshop
- Sure-Fire Trading Systems (VectorVest, Inc.)
- Trading as a Business Workshop
- VectorVest 7 EOD
- VectorVest 7 RealTime/IntraDay
- VectorVest AutoTester
- VectorVest Educational Services
- VectorVest OnLine
- VectorVest Options Analyzer
- VectorVest ProGraphics v6.0
- VectorVest ProTrader 7
- VectorVest RealTime Derby Tool
- VectorVest Simulator
- VectorVest Variator
- VectorVest Watchdog
