HOT TOPICS LIST
- MACD
- Fibonacci
- RSI
- Gann
- ADXR
- Stochastics
- Volume
- Triangles
- Futures
- Cycles
- Volatility
- ZIGZAG
- MESA
- Retracement
- Aroon
INDICATORS LIST
LIST OF TOPICS
PRINT THIS ARTICLE
by Donald W. Pendergast, Jr.
Sometimes, traders are blessed with a major trend-following move. At other times, they need to settle for slow but steady gains, as the outcome of this trade demonstrates.
Position: N/A
Donald W. Pendergast, Jr.
Donald W. Pendergast is a financial markets consultant who offers specialized services to stock brokers and high net worth individuals who seek a better bottom line for their portfolios.
PRINT THIS ARTICLE
OPTIONS TRADING
FCG's Simple Covered Call Play
09/03/09 10:05:36 AMby Donald W. Pendergast, Jr.
Sometimes, traders are blessed with a major trend-following move. At other times, they need to settle for slow but steady gains, as the outcome of this trade demonstrates.
Position: N/A
| While often profitable, covered call trading can also be about as much fun as watching paint dry. However, if the idea of consistent monthly profits is appealing to you, then you may wish to learn a little more about this time-honored equity market strategy. I often write about potential covered-call setups here at Traders.com Advantage, so why not follow along for a nuts & bolts look at the technical and seasonal factors that compelled me to place this real-life covered call trade, one using an exchange traded fund (ETF) that tracks a basket of natural gas equities? |

|
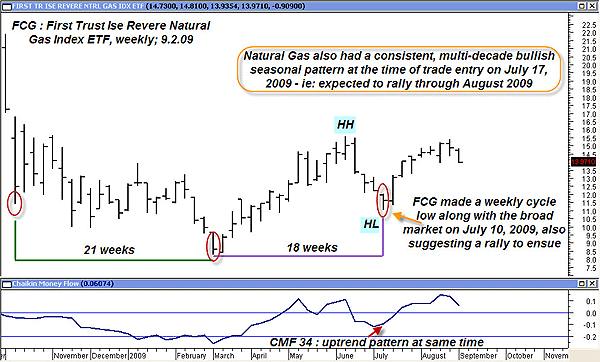
| FIGURE 1: FCG, WEEKLY. Placing covered call trades soon after a confirmed weekly cycle low is one of the best ways to limit risk and enhance profitability. FCG bottomed along with the broad markets on July 10, 2009, rallying well into August 2009. |
| Graphic provided by: MetaStock. |
| |
| We'll start with the weekly chart of FCG, the First Trust Ise Revere Natural Gas Index exchange traded fund (ETF) (Figure 1), a tradable that tracks the aggregate price performance of a basket of big-name natural gas producer stocks like Apache (APA) and Anadarko Petroleum (APC), among others. I had already anticipated a major weekly cycle in the broad US markets (particularly the Standard & Poor's 500 and Russell 2000 indexes) to occur by mid- to late July, so when the markets finally bottomed and reversed sharply higher around July 10-July 13, 2009, I was prepared to go long. I focused on natural gas equities in part due to the fact that natural gas has a very reliable (19 years) seasonal tendency to make a major low sometime in mid-July before rallying well into August. Given the powerful combination of a seasonal low and a major weekly cycle low, I began to investigate the opportunities available, finally settling on an FCG covered call trade instead of going with an individual component stock from the same ETF. There is generally less company-specific risk when trading ETFs rather than putting an equal amount of funds into a component stock, for obvious reasons; if a given stock has a problem with its books, a bad earnings report, or whatever, you're going to have a bumpy ride on your covered call trade. Trading the ETF removes much of the risk, so I settled on buying 100 shares of FCG and then selling a slightly in-the-money covered call against the position, an August 2009 $13 call set to expire on August 21, 2009. As we move over to the daily chart (Figure 2), you can see some of the other technical factors that also played a role in helping both confirm and time the entry on this trade. |

|
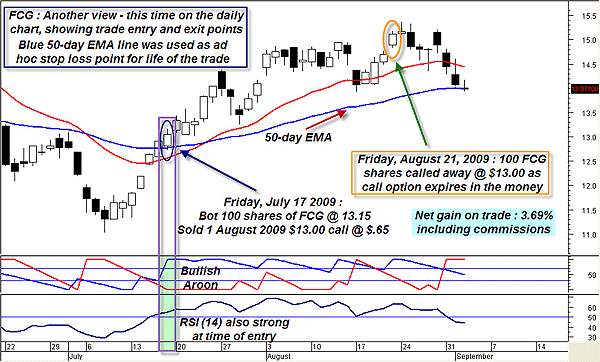
| FIGURE 2: FCG, DAILY. Ensuring that the weekly trend, weekly cycle, and daily technicals are all bullishly aligned is critical to the success of a covered call trade. Risk control is also paramount for consistent success; always use a stop-loss. |
| Graphic provided by: MetaStock. |
| |
| FCG's daily chart shows many favorable technicals on the date this covered call trade was entered on July 17, 2009. Note that the stock had just cleared the 50-day exponential moving average (EMA), only five trading days after making that major weekly low on July 10. At the same time the RSI (14) was at 55 and looking very strong in the wake of the reversal, as was the Aroon (14) trend indicator, which had just completed a very bullish-looking crossover. This was not a big money trade, but proper risk control was used anyway. I decided to use the 50-day EMA as a fail-safe exit point; a daily close of FCG below the blue line at any point on the trade would demand a closeout of the trade, regardless of any bullish opinions I possessed on the natural gas industry group stocks. Alternatively, I could have used a daily Aroon (14) close of 50 or lower as an official get-out point. |
| You can see the trade results in Figure 2; the trade netted 3.69% in five weeks and turned out to be a stress-free episode in trading, mostly due to proper biasing of the trade in line with the major cyclical and seasonal tendencies most directly affecting it. You can also apply these same simple technical tools to the stocks you'd like to write covered calls on. Essentially, you want the broad market to be in a bullish weekly cycle that is likely to last longer than the life of the call you want to sell against your long stock position. Next, you also want to make sure that the stock is in a weekly uptrend (higher highs and higher lows) and that either the daily average directional movement index (ADX) and/or Aroon indicator is in bullish mode, with the daily relative strength index (RSI) (14) also in a strong trending mode. Finally, check the money flows on both a daily and weekly basis. If they are both in a bullish mode, your chances of covered call trading success should be greatly enhanced. In addition, don't forget to check the bid-ask spread and implied volatility readings on the calls you wish to sell; it pays to wait sometimes to make sure you have as many of these factors working in your favor. Try it out sometime and see if these simple techniques don't help improve your covered call trades. |
Donald W. Pendergast is a financial markets consultant who offers specialized services to stock brokers and high net worth individuals who seek a better bottom line for their portfolios.
| Title: | Writer, market consultant |
| Company: | Linear Trading Systems LLC |
| Jacksonville, FL 32217 | |
| Phone # for sales: | 904-239-9564 |
| E-mail address: | lineartradingsys@gmail.com |
Traders' Resource Links | |
| Linear Trading Systems LLC has not added any product or service information to TRADERS' RESOURCE. | |
Click here for more information about our publications!
Comments
Date: 09/06/09Rank: 2Comment:

Request Information From Our Sponsors
- VectorVest, Inc.
- Executive Premier Workshop
- One-Day Options Course
- OptionsPro
- Retirement Income Workshop
- Sure-Fire Trading Systems (VectorVest, Inc.)
- Trading as a Business Workshop
- VectorVest 7 EOD
- VectorVest 7 RealTime/IntraDay
- VectorVest AutoTester
- VectorVest Educational Services
- VectorVest OnLine
- VectorVest Options Analyzer
- VectorVest ProGraphics v6.0
- VectorVest ProTrader 7
- VectorVest RealTime Derby Tool
- VectorVest Simulator
- VectorVest Variator
- VectorVest Watchdog
- StockCharts.com, Inc.
- Candle Patterns
- Candlestick Charting Explained
- Intermarket Technical Analysis
- John Murphy on Chart Analysis
- John Murphy's Chart Pattern Recognition
- John Murphy's Market Message
- MurphyExplainsMarketAnalysis-Intermarket Analysis
- MurphyExplainsMarketAnalysis-Visual Analysis
- StockCharts.com
- Technical Analysis of the Financial Markets
- The Visual Investor
