HOT TOPICS LIST
- MACD
- Fibonacci
- RSI
- Gann
- ADXR
- Stochastics
- Volume
- Triangles
- Futures
- Cycles
- Volatility
- ZIGZAG
- MESA
- Retracement
- Aroon
INDICATORS LIST
LIST OF TOPICS
PRINT THIS ARTICLE
by Chaitali Mohile
Is the Health Care Provider Index undergoing a short-term downtrend?
Position: N/A
Chaitali Mohile
Active trader in the Indian stock markets since 2003 and a full-time writer. Trading is largely based upon technical analysis.
PRINT THIS ARTICLE
WEDGE FORMATIONS
Health Care Index Rally Restricted
09/03/09 09:29:53 AMby Chaitali Mohile
Is the Health Care Provider Index undergoing a short-term downtrend?
Position: N/A
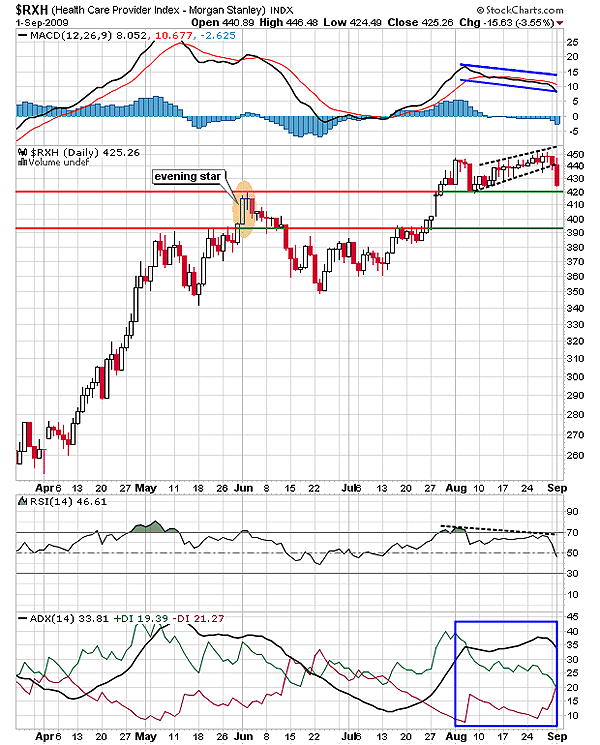
| For the Health Care Provider Index ($RXH), the 390-420 area was a strong support-resistance zone. An evening star candlestick pattern within this range indicated a bearish reversal rally for $RXH. Thereafter, the rally retraced to a previous low support at the 350 level. This candlestick pattern is a cluster of three candlesticks, with first a bullish candle followed by a doji. The third candle is a decision maker, as only the bearish candle can complete the evening star formation. If a candle other than a bearish one appears, the short-term trading strategy might change. In Figure 1, the colored oval shows the evening star candlestick pattern and the two support-resistance lines tool highlight the zone at 390 and 420. |
| Since the moving average convergence/divergence (MACD) (12,26,9) and the relative strength index (RSI) (14) were not ready to give up their bullish hold, $RXH hurriedly established the support at the 350 level. The indicators and the price movements lead each another. Interpreting price action becomes easier due to the indicators. We can see in Figure 1 that the MACD (12,26,9) and the RSI (14) established support at the center line that is the zero line and 50 levels, respectively. The indicators surged dramatically, pulling the index above the various support-resistance zone. In addition, the average directional movement index (ADX) (14) surged with a heavy buying pressure, reversing a downtrend. |

|
| FIGURE 1: $RXH, DAILY. The rising wedge bearish breakout has immediate support at the 420 level. The bullish indicator would prevent further downfall. |
| Graphic provided by: StockCharts.com. |
| |
| Gradually, the index reached another higher level. But we can see in Figure 1 that $RXH slowed down at this level. The small candles including various doji formed a rising wedge -- a bearish reversal pattern. The rising wedge formation breaks downward, initiating a new bearish rally. The reason for this the bearish reversal formation is the negative divergence by the MACD (12.26,9) and the RSI (14). The wedge in Figure 1 has recently broken in a bearish direction, restricting the prior bullish rally. Although all the three indicators are declining, they have robust supports in the bullish territory. The uptrend remains intact; therefore, the bearish breakout may not turn in a serious correction. |

|
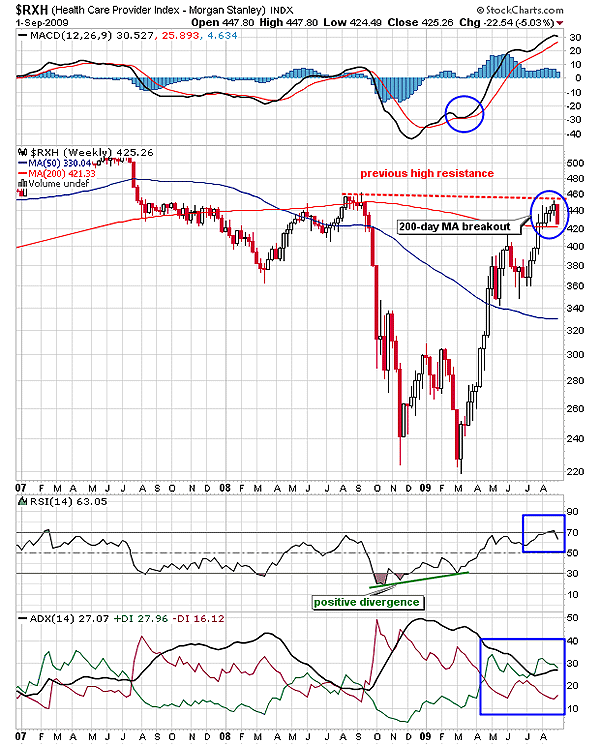
| FIGURE 2: $RXH, WEEKLY. The index has hit the prior high resistance, and as a result, the price is likely to retrace at the 200-day MA support. |
| Graphic provided by: StockCharts.com. |
| |
| The weekly chart in Figure 2 reveals another reason for the bearish breakdown. The rally that began on the bullish notes has reached the previous high resistance at the 450-460 level. The positive divergence by the RSI (14) and an overheated downtrend geared up the up move in March 2009. After reaching the prior top, $RXH has turned reluctantly to move higher. Currently, the index retraced to its immediate support of the 200-day moving average (MA). The 200-day MA is a long-term technical tool, extending robust support or resistance. The breakout or breakdown of this MA is considered a long-term trend reversal and watched by major technical analysts around the world. Therefore, the 200-day MA support for $RXH is the most reliable technical support that cannot be breached easily. In addition, the ADX (14) is suggesting a developing uptrend. |
| Hence, $RXH is likely to establish the support and would consolidate near the 200-day MA. Current financial turmoil would add volatility during consolidation, threatening the 200-day MA support. Therefore, the related stock should be traded carefully. |
Active trader in the Indian stock markets since 2003 and a full-time writer. Trading is largely based upon technical analysis.
| Company: | Independent |
| Address: | C1/3 Parth Indraprasth Towers. Vastrapur |
| Ahmedabad, Guj 380015 | |
| E-mail address: | chaitalimohile@yahoo.co.in |
Traders' Resource Links | |
| Independent has not added any product or service information to TRADERS' RESOURCE. | |
Click here for more information about our publications!
Comments

Request Information From Our Sponsors
- StockCharts.com, Inc.
- Candle Patterns
- Candlestick Charting Explained
- Intermarket Technical Analysis
- John Murphy on Chart Analysis
- John Murphy's Chart Pattern Recognition
- John Murphy's Market Message
- MurphyExplainsMarketAnalysis-Intermarket Analysis
- MurphyExplainsMarketAnalysis-Visual Analysis
- StockCharts.com
- Technical Analysis of the Financial Markets
- The Visual Investor
- VectorVest, Inc.
- Executive Premier Workshop
- One-Day Options Course
- OptionsPro
- Retirement Income Workshop
- Sure-Fire Trading Systems (VectorVest, Inc.)
- Trading as a Business Workshop
- VectorVest 7 EOD
- VectorVest 7 RealTime/IntraDay
- VectorVest AutoTester
- VectorVest Educational Services
- VectorVest OnLine
- VectorVest Options Analyzer
- VectorVest ProGraphics v6.0
- VectorVest ProTrader 7
- VectorVest RealTime Derby Tool
- VectorVest Simulator
- VectorVest Variator
- VectorVest Watchdog
