HOT TOPICS LIST
- MACD
- Fibonacci
- RSI
- Gann
- ADXR
- Stochastics
- Volume
- Triangles
- Futures
- Cycles
- Volatility
- ZIGZAG
- MESA
- Retracement
- Aroon
INDICATORS LIST
LIST OF TOPICS
PRINT THIS ARTICLE
by Ron Walker
A series of bullish belt hold candlesticks have materialized on the daily chart of the VIX reinforcing a new base of support. But will these bullish belt holds bolster the bears?
Position: N/A
Ron Walker
Ron Walker is an active trader and technical analyst. He operates an educational website dedicated to the study of Technical Analysis. The website offers free market analysis with daily video presentations and written commentaries. Ron is a video pioneer, being one of the first to utilize the internet producing Technical Analysis videos. His website is thechartpatterntrader.com
PRINT THIS ARTICLE
VOLATILITY
Bullish Belt Holds Bolster The Bears
09/02/09 09:13:46 AMby Ron Walker
A series of bullish belt hold candlesticks have materialized on the daily chart of the VIX reinforcing a new base of support. But will these bullish belt holds bolster the bears?
Position: N/A
| The Chicago Board Options Exchange Volatility Index (VIX) measures the implied volatility of the Standard & Poor's 500 index options. When the index climbs higher, volatility in the stock market greatly increases. This index is used to gauge fear. The VIX is quoted in percentage points and estimates the movement of the S&P 500 over the next 30 days on an annualized basis. The current reading of 26% suggests that option traders in the S&P 500 (SPX) options anticipate SPX to move to the 26% range over the next 12 months. However, the VIX looks poised to move much higher in the coming weeks ahead. If the VIX begins to move higher, it would usher in an overdue correction in the stock market. |

|
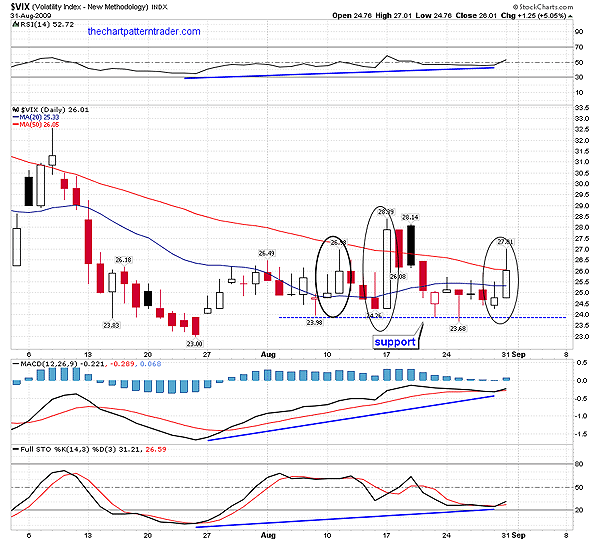
| FIGURE 1: VIX, DAILY. Circled in black are three bullish inverted hammers that formed at key support near 24%. Each inverted hammer was followed by a long bullish belt hold candlestick. The MACD, stochastic, and RSI each have confirmed the higher lows that formed a base of support at 24%. That may allow the VIX to clear the 50-day SMA. |
| Graphic provided by: StockCharts.com. |
| |
| Figure 1 shows the VIX bottomed out at 23% in late July, and then sidestepped through August in a tight contained price range, all the while closing above 24%. In mid-August, the VIX clambered to a slightly higher high, but quickly lost steam and retested support. Regardless of a failed rally on the VIX, it still has successfully produced a higher low, with a groundswell of support at the 24% level (Figure 1). A series of bullish belt hold patterns have cropped up each time that support touched near the 24 level. The bullish belt hold pattern occurs when the candle for that session opens at its low, then rallies hard against the previous trend and manages to finish the session near the highs of the day. The belt hold candle is a long wide range bar representing a reversal. The belt hold one-day reversal pattern is unique in that it has no lower shadow at the lower end. Ironically, each time a bullish inverted hammer appeared at support it was followed by a bullish belt hold pattern (see that candle combinations circled in Figure 1). |
| In Figure 1 we can see that the VIX has had some trouble getting above both the 20- and 50-day simple moving averages in July and August. Both attempts failed. But the sequel of bullish belt hold candles might give the VIX the boost it needs to clear those two moving averages. |

|
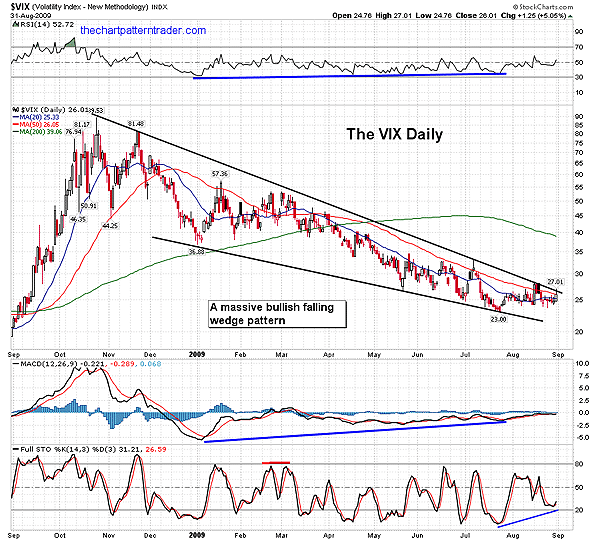
| FIGURE 2: VIX, DAILY. If the current belt hold produces a higher high, we will see the long-term downtrend broken here on the daily chart. Both the RSI and the MACD have long-term bullish divergences that are now beginning to build momentum on the VIX. |
| Graphic provided by: StockCharts.com. |
| |
| Figure 2 shows the daily activity of VIX over the past year. At the hard right edge of the price chart, you will see that the most recent belt hold candle nudged right up to the long-term declining trendline. The closeup of the daily chart in Figure 1 shows some very bullish signals that may cause the VIX to explode soon. The moving average convergence/divergence (MACD) (12, 26, 9) has confirmed a higher low and is creeping up to the zero line. The stochastic (14, 3, 3) and relative strength index (RSI) (14) also have higher lows. The stochastic got a bullish cross and is firming up above 20 (oversold levels); meanwhile, the RSI snapped above its median line of 50. |

|
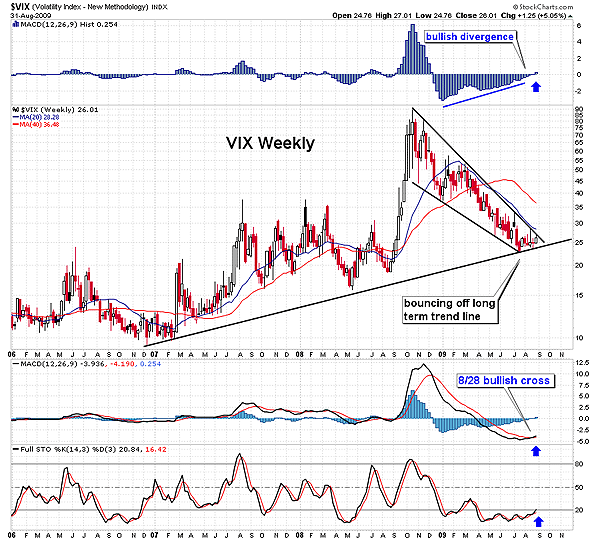
| FIGURE 3: VIX, WEEKLY. The MACD on the VIX finally got a bullish cross on August 28. Bouncing off the long-term trendline should give the VIX the traction it needs to break out of the bullish falling wedge pattern. |
| Graphic provided by: StockCharts.com. |
| |
| The weekly chart of the VIX in Figure 3 also looks to be revving up. The MACD histogram moved above the center line after it completed a long-term bullish divergence with the VIX. Currently, the slope of the MACD histogram bars is up (rising bars) in the weekly time frame and shows that bears are now back in the driver's seat. The MACD got a bullish cross on August 28, while the stochastic sprang above 20. A bullish falling wedge price pattern has formed off the primary trendline from the end of 2006. All these signs suggest that it is a favorable environment for short positions. The current bullish belt hold needs a confirmation itself by a close that is above the high of the highest point in the candle pattern. In this case, we would need to see a close above the wick peak in the belt hold candle at 27.01%. That would push the VIX to a new high and break the downtrend, energizing the bears. |
Ron Walker is an active trader and technical analyst. He operates an educational website dedicated to the study of Technical Analysis. The website offers free market analysis with daily video presentations and written commentaries. Ron is a video pioneer, being one of the first to utilize the internet producing Technical Analysis videos. His website is thechartpatterntrader.com
| Website: | thechartpatterntrader.com |
| E-mail address: | thechartpatterntrader@gmail.com |
Click here for more information about our publications!
Comments
Date: 09/02/09Rank: 1Comment:
Date: 09/06/09Rank: 3Comment:

Request Information From Our Sponsors
- StockCharts.com, Inc.
- Candle Patterns
- Candlestick Charting Explained
- Intermarket Technical Analysis
- John Murphy on Chart Analysis
- John Murphy's Chart Pattern Recognition
- John Murphy's Market Message
- MurphyExplainsMarketAnalysis-Intermarket Analysis
- MurphyExplainsMarketAnalysis-Visual Analysis
- StockCharts.com
- Technical Analysis of the Financial Markets
- The Visual Investor
- VectorVest, Inc.
- Executive Premier Workshop
- One-Day Options Course
- OptionsPro
- Retirement Income Workshop
- Sure-Fire Trading Systems (VectorVest, Inc.)
- Trading as a Business Workshop
- VectorVest 7 EOD
- VectorVest 7 RealTime/IntraDay
- VectorVest AutoTester
- VectorVest Educational Services
- VectorVest OnLine
- VectorVest Options Analyzer
- VectorVest ProGraphics v6.0
- VectorVest ProTrader 7
- VectorVest RealTime Derby Tool
- VectorVest Simulator
- VectorVest Variator
- VectorVest Watchdog
