HOT TOPICS LIST
- MACD
- Fibonacci
- RSI
- Gann
- ADXR
- Stochastics
- Volume
- Triangles
- Futures
- Cycles
- Volatility
- ZIGZAG
- MESA
- Retracement
- Aroon
INDICATORS LIST
LIST OF TOPICS
PRINT THIS ARTICLE
by Mike Carr, CMT
Traders seem obsessed with timing buys in gold. But there might be better investment opportunities in the metals that get overlooked.
Position: N/A
Mike Carr, CMT
Mike Carr, CMT, is a member of the Market Technicians Association, and editor of the MTA's newsletter, Technically Speaking. He is also the author of "Smarter Investing in Any Economy: The Definitive Guide to Relative Strength Investing," and "Conquering the Divide: How to Use Economic Indicators to Catch Stock Market Trends."
PRINT THIS ARTICLE
RSI
Time To Buy Gold?
09/01/09 08:50:48 AMby Mike Carr, CMT
Traders seem obsessed with timing buys in gold. But there might be better investment opportunities in the metals that get overlooked.
Position: N/A
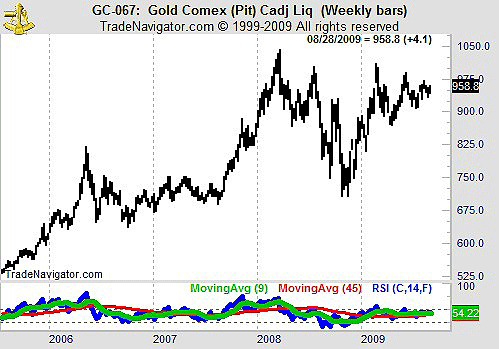
| Gold has a certain mystique and a reputation as an inflation hedge. The truth is, traders can profit from large swings in the price of gold, but investors should probably look elsewhere. We see in Figure 1 that gold has been in a broad trading range most of the year. In addition, the relative strength index (RSI) has remained below 60 on a weekly chart. In a true bull market, the RSI will generally move above 60. |

|
| FIGURE 1: GC, WEEKLY. Other than large moves that allow traders to profit, there is really nothing bullish in this chart of gold despite the widely heralded move toward a price level of $1,000 an ounce. |
| Graphic provided by: Trade Navigator. |
| |
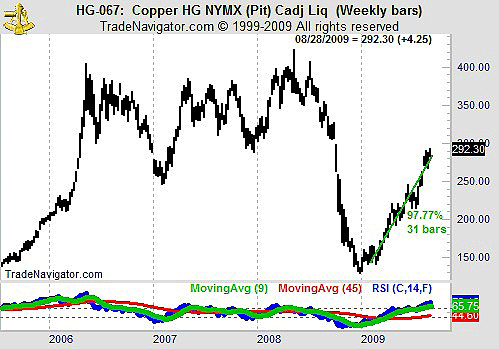
| Meanwhile, copper has clearly been in a bull market this year (Figure 2). This metal is up almost 100% since the RSI broke above its long-term moving average. The RSI has also been above 40 all year, such behavior most often associated with bullish moves. |

|
| FIGURE 2: HG, WEEKLY. Little noticed in the media, copper has delivered big profits to traders. |
| Graphic provided by: Trade Navigator. |
| |
| These two charts illustrate the idea that rather than watching the news for trading ideas, traders should look at their charts. Copper can be traded as an exchange traded fund (ETF), in the futures market, or through the shares of mining companies. |
Mike Carr, CMT, is a member of the Market Technicians Association, and editor of the MTA's newsletter, Technically Speaking. He is also the author of "Smarter Investing in Any Economy: The Definitive Guide to Relative Strength Investing," and "Conquering the Divide: How to Use Economic Indicators to Catch Stock Market Trends."
| Website: | www.moneynews.com/blogs/MichaelCarr/id-73 |
| E-mail address: | marketstrategist@gmail.com |
Click here for more information about our publications!
Comments
Date: 09/01/09Rank: 4Comment:
Date: 09/08/09Rank: 4Comment:

Request Information From Our Sponsors
- StockCharts.com, Inc.
- Candle Patterns
- Candlestick Charting Explained
- Intermarket Technical Analysis
- John Murphy on Chart Analysis
- John Murphy's Chart Pattern Recognition
- John Murphy's Market Message
- MurphyExplainsMarketAnalysis-Intermarket Analysis
- MurphyExplainsMarketAnalysis-Visual Analysis
- StockCharts.com
- Technical Analysis of the Financial Markets
- The Visual Investor
- VectorVest, Inc.
- Executive Premier Workshop
- One-Day Options Course
- OptionsPro
- Retirement Income Workshop
- Sure-Fire Trading Systems (VectorVest, Inc.)
- Trading as a Business Workshop
- VectorVest 7 EOD
- VectorVest 7 RealTime/IntraDay
- VectorVest AutoTester
- VectorVest Educational Services
- VectorVest OnLine
- VectorVest Options Analyzer
- VectorVest ProGraphics v6.0
- VectorVest ProTrader 7
- VectorVest RealTime Derby Tool
- VectorVest Simulator
- VectorVest Variator
- VectorVest Watchdog
