HOT TOPICS LIST
- MACD
- Fibonacci
- RSI
- Gann
- ADXR
- Stochastics
- Volume
- Triangles
- Futures
- Cycles
- Volatility
- ZIGZAG
- MESA
- Retracement
- Aroon
INDICATORS LIST
LIST OF TOPICS
PRINT THIS ARTICLE
by Austin Passamonte
Near-term price action for the Russell 2000 index.
Position: N/A
Austin Passamonte
Austin is a private trader who trades emini stock index futures intraday. He currently trades various futures markets from home in addition to managing a trader's educational forum
PRINT THIS ARTICLE
TECHNICAL ANALYSIS
Small Capped?
09/01/09 08:40:14 AMby Austin Passamonte
Near-term price action for the Russell 2000 index.
Position: N/A
| Alongside technology, small-cap stocks are a leading indicator of broad-based market bias. They tend to overshoot upward and downward, making greater percentage range moves intraday or across measured periods of trend relative to the bigger indexes. "Hot money" flows in and out of small stocks faster, and hence there is the greater speed of nimble turns up & down relative to the bigger indexes. |

|
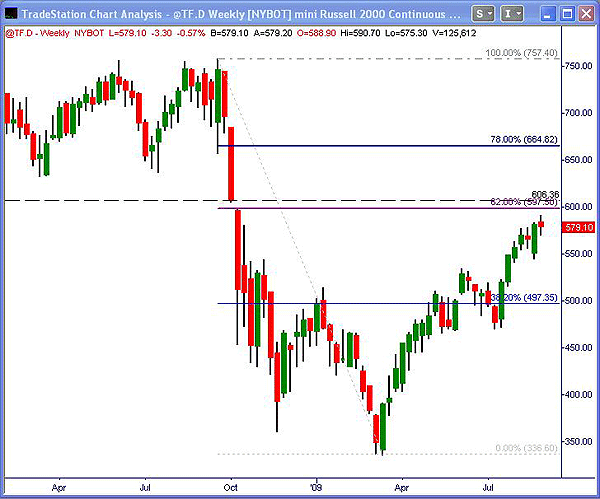
| FIGURE 1: TF, WEEKLY |
| Graphic provided by: TradeStation. |
| |
| Russell 2000 (TF) futures are within tapping distance of long-term clustered resistance. The 597.50 area is a 62% upside retracement of the macro high-low swing from the 2008 peak to the 2009 trough. For sure, that level has resting stop orders to buy/sell open and close clustered all around. Within 10 points of that mark is the still-open breakway gap from early October 2008 when all heck broke loose. Two primary price magnets like that within such close proximity beckon price action as the proverbial tractor beam. See Figure 1. |

|
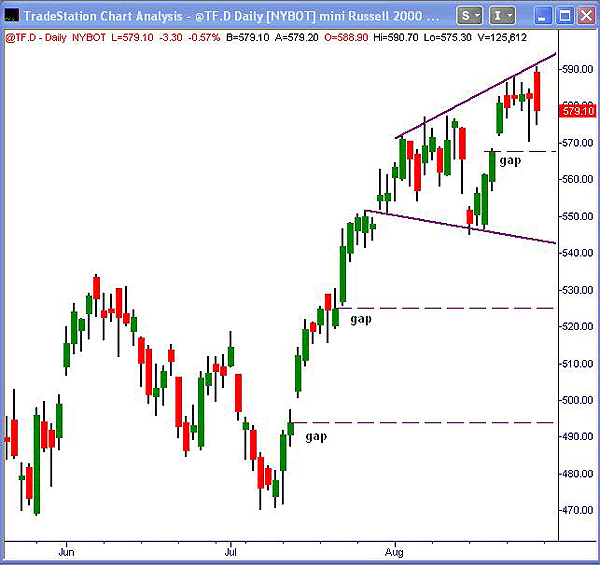
| FIURE 2: TF, DAILY |
| Graphic provided by: TradeStation. |
| |
| As with all other stock market indexes, two recent sessions painted a bullish hammer candle followed by a bearish engulfing candle. Friday, August 28, 2009, engulfed the high/low range of Monday to Wednesday that week. What little upside progress was made to that point in time was completely erased as the weekend arrived. See Figure 2. |
| No fewer than three open gaps still gap below. The usual air pockets exist within extended trend moves that this recent +120-point ascent from July lows left behind. There will be back & fill retrenchment sooner or later. A quick tap of the highest gap near 568 is merely a retest of prior resistance, now-presumed support. Anything deeper than that changes the near-term, full-bull mood. |
| An August megaphone wedge pattern shows price structure to be sideways, chopping and erratic overall. If this index can press above nearby layered resistance and base above on solid volume, blue skies prevail from there. Stuttering or stammering sends it back to the recent basement for further foundation building from open gaps on up, or otherwise down. |
Austin is a private trader who trades emini stock index futures intraday. He currently trades various futures markets from home in addition to managing a trader's educational forum
| Title: | Individual Trader |
| Company: | CoiledMarkets.com |
| Address: | PO Box 633 |
| Naples, NY 14512 | |
| Website: | coiledmarkets.com/blog |
| E-mail address: | austinp44@yahoo.com |
Traders' Resource Links | |
| CoiledMarkets.com has not added any product or service information to TRADERS' RESOURCE. | |
Click here for more information about our publications!
Comments
Date: 09/01/09Rank: 2Comment:

Request Information From Our Sponsors
- StockCharts.com, Inc.
- Candle Patterns
- Candlestick Charting Explained
- Intermarket Technical Analysis
- John Murphy on Chart Analysis
- John Murphy's Chart Pattern Recognition
- John Murphy's Market Message
- MurphyExplainsMarketAnalysis-Intermarket Analysis
- MurphyExplainsMarketAnalysis-Visual Analysis
- StockCharts.com
- Technical Analysis of the Financial Markets
- The Visual Investor
- VectorVest, Inc.
- Executive Premier Workshop
- One-Day Options Course
- OptionsPro
- Retirement Income Workshop
- Sure-Fire Trading Systems (VectorVest, Inc.)
- Trading as a Business Workshop
- VectorVest 7 EOD
- VectorVest 7 RealTime/IntraDay
- VectorVest AutoTester
- VectorVest Educational Services
- VectorVest OnLine
- VectorVest Options Analyzer
- VectorVest ProGraphics v6.0
- VectorVest ProTrader 7
- VectorVest RealTime Derby Tool
- VectorVest Simulator
- VectorVest Variator
- VectorVest Watchdog
