HOT TOPICS LIST
- MACD
- Fibonacci
- RSI
- Gann
- ADXR
- Stochastics
- Volume
- Triangles
- Futures
- Cycles
- Volatility
- ZIGZAG
- MESA
- Retracement
- Aroon
INDICATORS LIST
LIST OF TOPICS
PRINT THIS ARTICLE
by Austin Passamonte
The threat of interruption in global oil production could become a concern as world news events evolve in Asia and the Middle East.
Position: N/A
Austin Passamonte
Austin is a private trader who trades emini stock index futures intraday. He currently trades various futures markets from home in addition to managing a trader's educational forum
PRINT THIS ARTICLE
FLAGS AND PENNANTS
Drilling Deeper For Oil Services
10/12/01 02:18:38 PMby Austin Passamonte
The threat of interruption in global oil production could become a concern as world news events evolve in Asia and the Middle East.
Position: N/A
| Right now we have oil prices well off their recent highs and oil company stocks have followed suit. |
| Is this a good time to try buying solid companies near support or is that akin to catching a falling 55 gallon barrel full of crude? |

|
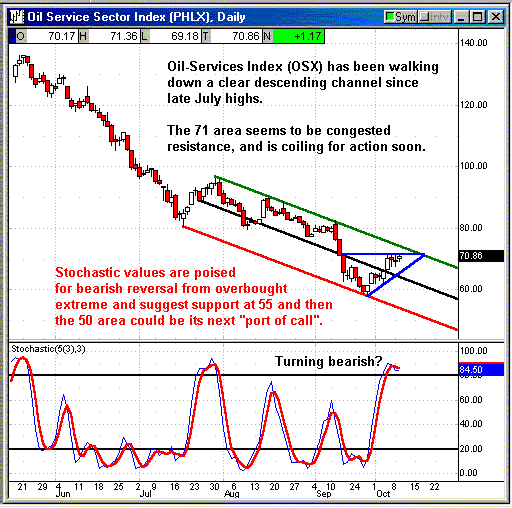
| Figure 1: Daily chart for the Oil Service Sector Index [OSX] |
| Graphic provided by: Quote.com. |
| Graphic provided by: QCharts. |
| |
| The Philadelphia Oil Services Index has been walking down a defined regression (descending) channel since mid-July and remains within those boundaries for now. An ascending bullish triangle is witnessed within this channel and a break above 73 level or higher on a close could signal bullish times ahead. However, stochastic values remain poised in an overbought extreme and warn that a strong breakout move may be less likely than another bounce from support near 55 or lower first. |
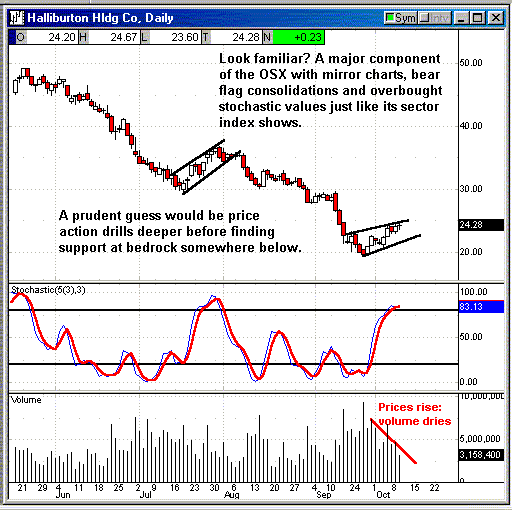
 Figure 2: Daily chart for Halliburton [HAL]. Halliburton is one of the major components in this index and sports a mirror-image chart as a result. We see an ascending bull flag formation with overbought stochastic values and declining up-volume to support increasing pressure to the upside. Breaking above this flag pattern on rising volume would be clear signs of a bullish reversal while waning up-volume or increasing down-volume would be fair warning that lower prices are ahead. Unless stock prices rise and break the bear flag pattern on strong volume to the upside, this recent exploration North on the chart may fail to strike pay dirt and necessitate a u-turn south before the next gusher is struck. |
Austin is a private trader who trades emini stock index futures intraday. He currently trades various futures markets from home in addition to managing a trader's educational forum
| Title: | Individual Trader |
| Company: | CoiledMarkets.com |
| Address: | PO Box 633 |
| Naples, NY 14512 | |
| Website: | coiledmarkets.com/blog |
| E-mail address: | austinp44@yahoo.com |
Traders' Resource Links | |
| CoiledMarkets.com has not added any product or service information to TRADERS' RESOURCE. | |
Click here for more information about our publications!
Comments
Date: 10/26/01Rank: 4Comment: hi!
thanks for nice article on oils.i am investing a family trust fund
and am looking at mostly reits for high dividend but am looking
at things like xto, cog, cocb, and some oils stocks for upswing
over the next few months.is it a good bet that the oils stocks
will rise over next 3 to 6 months?
thanks tom phillips
Date: 10/30/01Rank: 5Comment:

|

Request Information From Our Sponsors
- StockCharts.com, Inc.
- Candle Patterns
- Candlestick Charting Explained
- Intermarket Technical Analysis
- John Murphy on Chart Analysis
- John Murphy's Chart Pattern Recognition
- John Murphy's Market Message
- MurphyExplainsMarketAnalysis-Intermarket Analysis
- MurphyExplainsMarketAnalysis-Visual Analysis
- StockCharts.com
- Technical Analysis of the Financial Markets
- The Visual Investor
- VectorVest, Inc.
- Executive Premier Workshop
- One-Day Options Course
- OptionsPro
- Retirement Income Workshop
- Sure-Fire Trading Systems (VectorVest, Inc.)
- Trading as a Business Workshop
- VectorVest 7 EOD
- VectorVest 7 RealTime/IntraDay
- VectorVest AutoTester
- VectorVest Educational Services
- VectorVest OnLine
- VectorVest Options Analyzer
- VectorVest ProGraphics v6.0
- VectorVest ProTrader 7
- VectorVest RealTime Derby Tool
- VectorVest Simulator
- VectorVest Variator
- VectorVest Watchdog
