HOT TOPICS LIST
- MACD
- Fibonacci
- RSI
- Gann
- ADXR
- Stochastics
- Volume
- Triangles
- Futures
- Cycles
- Volatility
- ZIGZAG
- MESA
- Retracement
- Aroon
INDICATORS LIST
LIST OF TOPICS
PRINT THIS ARTICLE
by Mike Carr, CMT
Like most Wall Street wisdom, these words are commonly spoken but rarely defined.
Position: N/A
Mike Carr, CMT
Mike Carr, CMT, is a member of the Market Technicians Association, and editor of the MTA's newsletter, Technically Speaking. He is also the author of "Smarter Investing in Any Economy: The Definitive Guide to Relative Strength Investing," and "Conquering the Divide: How to Use Economic Indicators to Catch Stock Market Trends."
PRINT THIS ARTICLE
RSI
The Trend Is Your Friend
08/27/09 11:33:34 AMby Mike Carr, CMT
Like most Wall Street wisdom, these words are commonly spoken but rarely defined.
Position: N/A
| Many analysts resort to simple techniques such as moving averages to determine the trend. Usually, a long-term moving average, like the 50-day or 200-day, is selected. If prices are above the average, then the direction of the trend is considered to be up. When prices fall below the average, the trend is down. This technique works well under most circumstances. |
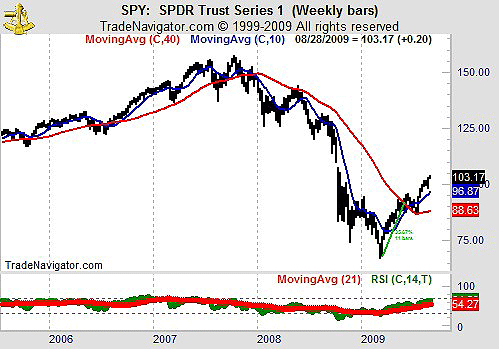
| In highly volatile markets, the signals will be delayed. At times like that, and actually most other times, it is helpful to look at a momentum indicator with a moving average (Figure 1). In this case, using relative strength index (RSI) calculated over the past 14 weeks with a 21-week moving average, the trend reversal signal occurred a week earlier than it did with the 10-week moving average and 11 weeks earlier than it did with the 40-week moving average. This technique turned bearish near the top in 2008 and caught a minor upswing during that long decline. |

|
| FIGURE 1: SPY, WEEKLY. Momentum indicators with moving averages offer earlier signs of trend reversal in many cases. |
| Graphic provided by: Trade Navigator. |
| |
| What does this mean to traders? Most of your trades should be on the long side in an uptrend. Short positions and cash are the best bets in a downtrend. And during those periods when the indicator is whipsawing, caution is the best approach and cash is a great idea. But using a momentum indicator to spot the trend will usually get you on the right side of the long-term trend a little early. |
Mike Carr, CMT, is a member of the Market Technicians Association, and editor of the MTA's newsletter, Technically Speaking. He is also the author of "Smarter Investing in Any Economy: The Definitive Guide to Relative Strength Investing," and "Conquering the Divide: How to Use Economic Indicators to Catch Stock Market Trends."
| Website: | www.moneynews.com/blogs/MichaelCarr/id-73 |
| E-mail address: | marketstrategist@gmail.com |
Click here for more information about our publications!
Comments
Date: 08/27/09Rank: 5Comment:

Request Information From Our Sponsors
- StockCharts.com, Inc.
- Candle Patterns
- Candlestick Charting Explained
- Intermarket Technical Analysis
- John Murphy on Chart Analysis
- John Murphy's Chart Pattern Recognition
- John Murphy's Market Message
- MurphyExplainsMarketAnalysis-Intermarket Analysis
- MurphyExplainsMarketAnalysis-Visual Analysis
- StockCharts.com
- Technical Analysis of the Financial Markets
- The Visual Investor
- VectorVest, Inc.
- Executive Premier Workshop
- One-Day Options Course
- OptionsPro
- Retirement Income Workshop
- Sure-Fire Trading Systems (VectorVest, Inc.)
- Trading as a Business Workshop
- VectorVest 7 EOD
- VectorVest 7 RealTime/IntraDay
- VectorVest AutoTester
- VectorVest Educational Services
- VectorVest OnLine
- VectorVest Options Analyzer
- VectorVest ProGraphics v6.0
- VectorVest ProTrader 7
- VectorVest RealTime Derby Tool
- VectorVest Simulator
- VectorVest Variator
- VectorVest Watchdog
