HOT TOPICS LIST
- MACD
- Fibonacci
- RSI
- Gann
- ADXR
- Stochastics
- Volume
- Triangles
- Futures
- Cycles
- Volatility
- ZIGZAG
- MESA
- Retracement
- Aroon
INDICATORS LIST
LIST OF TOPICS
PRINT THIS ARTICLE
by Donald W. Pendergast, Jr.
Up by a mind-boggling 296% in less than six months, two powerful trading systems have both fired new long entry signals for Masco Corp., a leading home-improvement and building supply company.
Position: Buy
Donald W. Pendergast, Jr.
Donald W. Pendergast is a financial markets consultant who offers specialized services to stock brokers and high net worth individuals who seek a better bottom line for their portfolios.
PRINT THIS ARTICLE
TRADING SYSTEMS
For MAS, Two Systems Agree On A Buy
08/27/09 09:01:04 AMby Donald W. Pendergast, Jr.
Up by a mind-boggling 296% in less than six months, two powerful trading systems have both fired new long entry signals for Masco Corp., a leading home-improvement and building supply company.
Position: Buy
| Peaking in early 2005 at about $38 per share, Masco Corp. (MAS) common shares fell off the proverbial cliff over the next four years, losing 90% of their value. Bottoming out at a mere $3.64 in early March of this year, the stock's behavior since then has been a wonder to behold, up nearly 300% in 24 weeks. Right now, MAS shares boast some of the best relative strength ratings versus the Standard & Poor's 500, and even better, two powerful trading systems have just given the green light for new long positions in this high-flier from the building/construction stock industry group. Let's have a closer look at this setup now. |

|
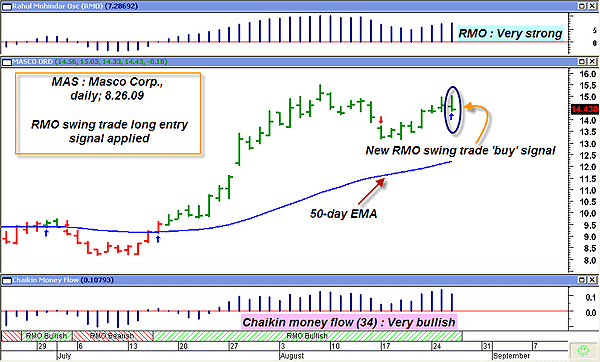
| FIGURE 1: MAS, DAILY. Nearly any trading signal setup can be filtered by making sure that money flow and momentum factors are aligned properly. Here, an RMO swing trade buy signal is confirmed in this manner. |
| Graphic provided by: MetaStock. |
| Graphic provided by: Rahul Mohindar indicator from MetaStock. |
| |
| We'll start with the most recent buy signal generated for this stock, the one just issued by the RMO trading template in MetaStock. The RMO model was developed by Rahul Mohindar, a well-known and highly regarded trader and system designer who also appears on various financial network programs around the world. While there are several kinds of RMO indicators available in MetaStock, the RMO swing trade buy (sell) signals are among the most useful, and that's what we'll be looking at in Figure 1. The buy signal (highlighted with a blue oval) arrives at an interesting period of chart configuration for MAS; first off, a well-established uptrend is already in place -- note the higher highs and higher lows along with the upward slope of the 50-day exponential moving average (EMA) (blue line on chart). Next, note the bullish posture of the RMO at the top of the chart. It is firmly biased to the bullish side of the equation, also giving extra weight to this particular buy signal, even as the Chaikin money flow (CMF)(34) indicator (bottom of the chart) also demonstrates the strong flow of cash into MAS. This all paints a very positive picture for those ready to commit to a long MAS position, even as the stock's strong relative strength ranking versus the S&P 500 offers even more confidence for buyers of this stock. But wait, there's more! Another proven system has also recently fired a buy signal for MAS. We'll take a look at that system's signal next. |

|
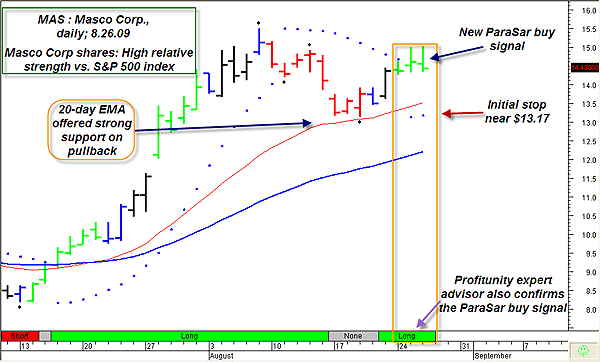
| FIGURE 2: MAS, DAILY. When two different systems agree on a common entry area, a trader's confidence level can get a much-needed boost. Here, J. Welles Wilder's parabolic stop and reverse system output agrees with the output of the RMO swing trade system. |
| Graphic provided by: MetaStock. |
| Graphic provided by: Profitunity - MetaStock expert advisor. |
| |
| Figure 2 is the same chart, overlaid with my MetaStock ParaSar template. Note that the actual ParaSar buy signal was triggered two trading sessions ago and that the stock is still very close to that original trigger price of $14.69. In fact, it's about $0.25 cheaper now, so perhaps waiting a few days for entry is a blessing in disguise. The Profitunity expert advisor (green horizontal panel at bottom of chart) is also confirming the general trendworthiness of MAS, which is the reason for the "long" designation. One interesting detail for chartists is the strong support exhibited by the 20-day EMA (red line on chart). Very often, the 20-period EMA (on any time frame, whether intraday, daily, weekly, or monthly) will act as a de facto support/resistance barrier, especially on an initial retracement back toward a significant Fibonacci retracement level, especially those of the 38%, 50%, and 62% kind. |
| Trade management is very simple: buy-stop Wednesday's high near $15.03 for the RMO swing buy signal or, if you prefer the ParaSar mode of signal generation, just buy at Thursday's open. Place an initial stop near $13.17, no matter which entry type you use, and then let the ParaSar trailing stops decide where each subsequent stop-loss level will be. In a long position, the ParaSar trailing stop will rise every day, so it will be very easy to follow along as the trade moves -- up, down or even sideways. You'll know soon enough what the outcome will be, and you'll be free of the constant worry of having to decide where to place your trailing stop at the end of each trading session. Both the ParaSar system (developed by J. Welles Wilder, one of the pioneers in the field of system development and technical indicator design) and the RMO system have produced several spectacular winners over the last six months, and while we don't know if this trade will also get us another check mark in the win column, at least we know that this trade setup has a strong set of probabilities leaning heavily in its favor. |
Donald W. Pendergast is a financial markets consultant who offers specialized services to stock brokers and high net worth individuals who seek a better bottom line for their portfolios.
| Title: | Writer, market consultant |
| Company: | Linear Trading Systems LLC |
| Jacksonville, FL 32217 | |
| Phone # for sales: | 904-239-9564 |
| E-mail address: | lineartradingsys@gmail.com |
Traders' Resource Links | |
| Linear Trading Systems LLC has not added any product or service information to TRADERS' RESOURCE. | |
Click here for more information about our publications!
Comments
Date: 08/27/09Rank: 5Comment:

Request Information From Our Sponsors
- StockCharts.com, Inc.
- Candle Patterns
- Candlestick Charting Explained
- Intermarket Technical Analysis
- John Murphy on Chart Analysis
- John Murphy's Chart Pattern Recognition
- John Murphy's Market Message
- MurphyExplainsMarketAnalysis-Intermarket Analysis
- MurphyExplainsMarketAnalysis-Visual Analysis
- StockCharts.com
- Technical Analysis of the Financial Markets
- The Visual Investor
- VectorVest, Inc.
- Executive Premier Workshop
- One-Day Options Course
- OptionsPro
- Retirement Income Workshop
- Sure-Fire Trading Systems (VectorVest, Inc.)
- Trading as a Business Workshop
- VectorVest 7 EOD
- VectorVest 7 RealTime/IntraDay
- VectorVest AutoTester
- VectorVest Educational Services
- VectorVest OnLine
- VectorVest Options Analyzer
- VectorVest ProGraphics v6.0
- VectorVest ProTrader 7
- VectorVest RealTime Derby Tool
- VectorVest Simulator
- VectorVest Variator
- VectorVest Watchdog
