

HOT TOPICS LIST
- MACD
- Fibonacci
- RSI
- Gann
- ADXR
- Stochastics
- Volume
- Triangles
- Futures
- Cycles
- Volatility
- ZIGZAG
- MESA
- Retracement
- Aroon
INDICATORS LIST
LIST OF TOPICS
PRINT THIS ARTICLE
by Donald W. Pendergast, Jr.
Based on a monthly performance ranking, the automotive industry group stocks are still on top, even though upward momentum is slowing. Conversely, the energy services stocks have been lagging for months but now appear ready to launch higher. Will these funds now do a complete about-face?
Position: N/A
Donald W. Pendergast, Jr.
Donald W. Pendergast is a financial markets consultant who offers specialized services to stock brokers and high net worth individuals who seek a better bottom line for their portfolios.
PRINT THIS ARTICLE
REL. STR COMPARATIVE
Are FSESX And FSAVX Trading Places?
08/25/09 08:35:05 AMby Donald W. Pendergast, Jr.
Based on a monthly performance ranking, the automotive industry group stocks are still on top, even though upward momentum is slowing. Conversely, the energy services stocks have been lagging for months but now appear ready to launch higher. Will these funds now do a complete about-face?
Position: N/A
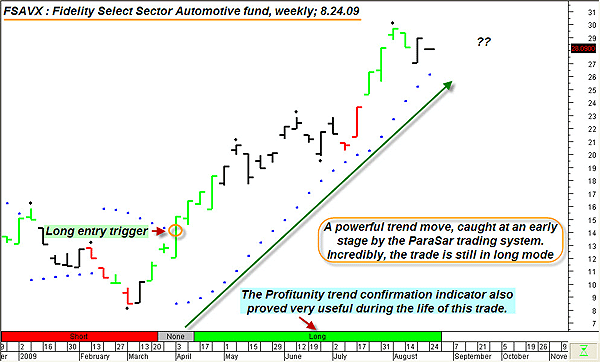
| Anyone following the stocks in the automotive industry group for the past few months must realize by now that what we've just witnessed is much more than a simple bear market rally. As bailout and stimulus and "Cash for Clunkers" funds began to flow, so did vast amounts of institutional money into the shares of the companies making up this heavily battered area of the stock market. And it still appears to be flowing; even though the rate of increase has begun to flatten out, the Fidelity Select Sector mutual fund that tracks the stocks in the automotive industry group still ranks #1 in terms of the best all-around performance over the past three-, six-, and 12-month time periods. Since the March 2009 lows, the fund is now 231% higher than it was less than six months ago, quite a feat for any stock industry group. We all know that we can't predict when a trend will finally end, but we can analyze the retracement/corrective moves along the way as well as measure the relative strength of the stock/group/sector/commodity in question to see if it's gaining or losing ground in relation to its peers. So, first up is a weekly chart of FSAVX, the Fidelity Select Sector Automotive fund (Figure 1). |
|
| FIGURE 1: FSAVX, WEEKLY. Up 231% -- and it's still an open trade. Combining the power of the ParaSar trading system with Profitunity expert advisors appears to be a very sound strategy. |
| Graphic provided by: MetaStock. |
| |
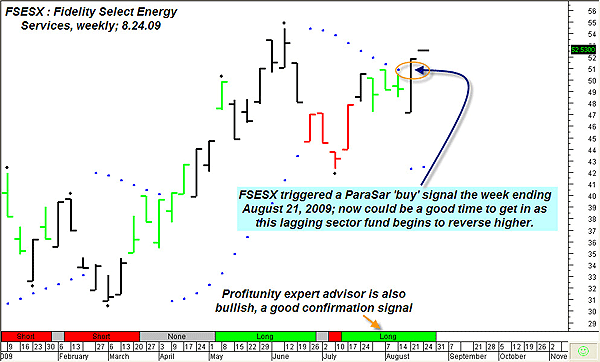
| If this chart isn't a great example of a terrific ParaSar long trade, then I don't know what is. ParaSar went long on FSAVX during the week ended April 3, 2009, and then just kept on going. It's still long as of this writing, even though it is drawing close to the ParaSar trailing stop. Note how using the Profitunity (Bill Williams') color bar expert (green area near bottom of chart) would also have been a great confidence-builder for those who actually took this trade. So if you got in on this magnificent trend move, congratulations. If not, no need to fret -- a different Fidelity Select Sector fund has just issued its own weekly ParaSar buy signal, which will be the focus of our next chart (Figure 2). |
|
| FIGURE 2: FSESX, WEEKLY. Lagging sector funds eventually turn around, and given the weight of the technical and fundamental evidence, this ParaSar buy signal in FSESX may be the first stage of a more sustained trend move higher. |
| Graphic provided by: MetaStock. |
| |
| The fact that the weakest fund in the entire Fidelity Select Sector fund complex has just issued a weekly ParaSar buy signal might be viewed as an incredible opportunity (for optimists) or as a risky gamble (for pessimists), depending on your view of a variety of fundamental and technical factors. My own take on this is more of the former and less of the latter, and here's why: * The Profitunity expert is also confirming that long positions are the way to go. * Prices have already risen significantly from the wash-out lows of last winter. * Prices have just cleared the flat 50-week exponential moving average (EMA) on a wide-range weekly reversal bar. * Crude oil prices are respecting the $70 price area. Bottom line, this appears to be a great, low-risk sector fund play, one custom-tailored for energy bulls. |
|
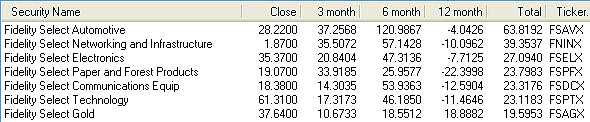
| FIGURE 3: TOP SEVEN FIDELITY SELECT SECTOR FUNDS, 8/24/09 |
| Graphic provided by: MetaStock. |
| Graphic provided by: MetaStock Explorer. |
| |
| Figure 3 is a look at the top seven Fidelity Select Sector funds; as repetitive as a broken record, FSAVX is still to be seen in the top position. Note how strong the entire technology sector groups still are. Gold mining stocks are still meandering, but expect big changes, and soon. |
|
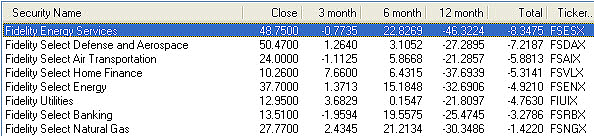
| FIGURE 4: BOTTOM EIGHT FIDELITY SELECT SECTOR FUNDS, 8/24/09 |
| Graphic provided by: MetaStock. |
| Graphic provided by: MetaStock Explorer. |
| |
| Figure 4 is a look at the kids from the other side of the tracks; in this neighborhood, stocks in the financial, aerospace/defense, energy, and utilities industry groups are camped out in the equity equivalent of Hooverville 2009. However, watch for the energy-related stocks to make their move soon, just like the gold mining stocks. |
Donald W. Pendergast is a financial markets consultant who offers specialized services to stock brokers and high net worth individuals who seek a better bottom line for their portfolios.
| Title: | Writer, market consultant |
| Company: | Linear Trading Systems LLC |
| Jacksonville, FL 32217 | |
| Phone # for sales: | 904-239-9564 |
| E-mail address: | lineartradingsys@gmail.com |
Traders' Resource Links | |
| Linear Trading Systems LLC has not added any product or service information to TRADERS' RESOURCE. | |
Click here for more information about our publications!
Comments
Date:�08/26/09Rank:�1Comment:�

Request Information From Our Sponsors
- StockCharts.com, Inc.
- Candle Patterns
- Candlestick Charting Explained
- Intermarket Technical Analysis
- John Murphy on Chart Analysis
- John Murphy's Chart Pattern Recognition
- John Murphy's Market Message
- MurphyExplainsMarketAnalysis-Intermarket Analysis
- MurphyExplainsMarketAnalysis-Visual Analysis
- StockCharts.com
- Technical Analysis of the Financial Markets
- The Visual Investor
- VectorVest, Inc.
- Executive Premier Workshop
- One-Day Options Course
- OptionsPro
- Retirement Income Workshop
- Sure-Fire Trading Systems (VectorVest, Inc.)
- Trading as a Business Workshop
- VectorVest 7 EOD
- VectorVest 7 RealTime/IntraDay
- VectorVest AutoTester
- VectorVest Educational Services
- VectorVest OnLine
- VectorVest Options Analyzer
- VectorVest ProGraphics v6.0
- VectorVest ProTrader 7
- VectorVest RealTime Derby Tool
- VectorVest Simulator
- VectorVest Variator
- VectorVest Watchdog