HOT TOPICS LIST
- MACD
- Fibonacci
- RSI
- Gann
- ADXR
- Stochastics
- Volume
- Triangles
- Futures
- Cycles
- Volatility
- ZIGZAG
- MESA
- Retracement
- Aroon
INDICATORS LIST
LIST OF TOPICS
PRINT THIS ARTICLE
by Alan R. Northam
The market rally off the March low began as a market correction in an ongoing bear market. Later it started to be called a bull market. When did the bear market officially end and the bull market begin?
Position: N/A
Alan R. Northam
Alan Northam lives in the Dallas, Texas area and as an electronic engineer gave him an analytical mind from which he has developed a thorough knowledge of stock market technical analysis. His abilities to analyze the future direction of the stock market has allowed him to successfully trade of his own portfolio over the last 30 years. Mr. Northam is now retired and trading the stock market full time. You can reach him at inquiry@tradersclassroom.com or by visiting his website at http://www.tradersclassroom.com. You can also follow him on Twitter @TradersClassrm.
PRINT THIS ARTICLE
DOW THEORY
When Did The Bull Market Officially Begin?
08/24/09 02:35:26 PMby Alan R. Northam
The market rally off the March low began as a market correction in an ongoing bear market. Later it started to be called a bull market. When did the bear market officially end and the bull market begin?
Position: N/A
| In a previous article published on June 8, 2009, entitled "S&P 500 Breaks Series Of Peaks And Troughs," I explained how peak and trough analysis defined the bear market that started in October 2007. The emphasis of that article was to explain that when the market breaks the series of lower peaks and lower troughs, the bear market downward trend was terminated. I then went on to explain that the termination of a bear market downtrend does not automatically signal the beginning of a new bull market uptrend but could simply be signaling the beginning of a trading range followed by the beginning of a new downward trend. I recommend rereading that article for background information. |
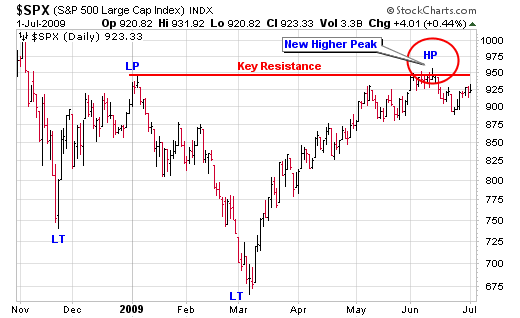
| Figure 1 below shows the daily bar chart of the S&P500 Index. This figure shows that the Standard & Poor's 500 broke the series of lower peaks and troughs in mid-June 2009 by forming a higher peak (labeled HP on the chart) to end the downward bear market trend. This figure is similar to the one in the previously mentioned article except the actual peak has been moved out about one week due to having the extra daily price bars available since the posting of the previous article. I have shown that a higher peak was made in mid-June by drawing a red horizontal resistance line off the last lower peak of the bear market downward trend made in early January. I call this line of resistance the "key resistance line" as the breaking of this resistance line is key to ending the downward bear market trend. |

|
| FIGURE 1: SPX, DAILY. This figure shows a new higher peak being formed in June 2009, officially ending the bear market downward trend that began in October 2007. |
| Graphic provided by: StockCharts.com. |
| |
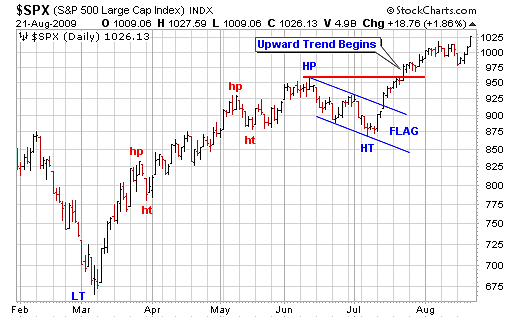
| In Figure 2, I zoomed in on the upward rally that started in March 2009. I have also removed the key resistance line for clarity of the chart. In the early 1900s, Charles Henry Dow determined that a new bull market trend was established when a market formed a new higher trough followed by a new higher peak. Figure 2 shows that in early July the S&P 500 formed a new higher trough (labeled HT on the chart). I have also drawn a red horizontal resistance line off the mid-June higher peak. The breakout above this resistance line constituted a new higher peak, thus fulfilling Charles Dow's rule for a new bull market upward trend. So officially, based upon Dow's rule, the current upward rally off the March low became a new bull market upward trend in late July. Up to this time, the rally was considered to be corrective. |

|
| FIGURE 2: SPX, DAILY. This figure shows the rally off the March 2009 low, showing that a new bull market upward trend began in late July 2009. |
| Graphic provided by: StockCharts.com. |
| |
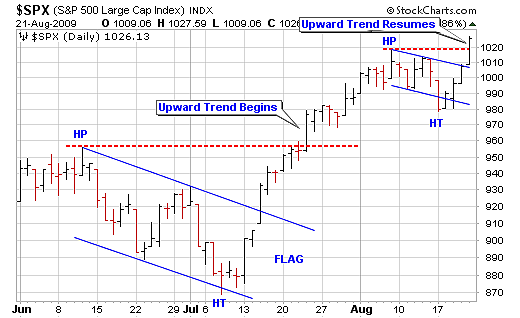
| Figure 3 zooms in on the current rally off the July lower trough. With a new bull market upward trend now having been established, any further pullbacks are considered to be corrective until proven otherwise. Figure 3 shows that in early August, the S&P 500 formed a new higher peak followed by a higher trough. Then on Friday, the last price bar on the chart, the market broke out above the higher peak made in early August, thus forming a new higher peak in progress. The higher peak in early August and the higher trough in mid-August then continued the series of higher peaks and troughs, signaling that the uptrend remains intact and the S&P 500 is now continuing to rally higher. |

|
| FIGURE 3: SPX, DAILY. This figure shows the rally off the July 2009 low, showing that a series of higher troughs and higher peaks being formed that define an upward trend in progress. |
| Graphic provided by: StockCharts.com. |
| |
| In conclusion, the peak and trough analysis shown in this article and the previous one along with Charles Dow's rule for determining when a new bull market trend begins became known as part of the Dow theory in later years after Charles Henry Dow's death. While there are many other parts that when combined form the complete Dow theory, here is what we have covered in this and the previous article: A bull market trend is defined as a series of higher troughs and higher peaks. A bear market trend is just the opposite, a series of lower peaks and lower troughs. In addition, a new bull market trend is said to have begun once a market makes a new higher trough followed by a higher peak and a new bear market trend is said to begin once a market forms a new lower peak followed by a new lower trough. |
Alan Northam lives in the Dallas, Texas area and as an electronic engineer gave him an analytical mind from which he has developed a thorough knowledge of stock market technical analysis. His abilities to analyze the future direction of the stock market has allowed him to successfully trade of his own portfolio over the last 30 years. Mr. Northam is now retired and trading the stock market full time. You can reach him at inquiry@tradersclassroom.com or by visiting his website at http://www.tradersclassroom.com. You can also follow him on Twitter @TradersClassrm.
| Garland, Tx | |
| Website: | www.tradersclassroom.com |
| E-mail address: | inquiry@tradersclassroom.com |
Click here for more information about our publications!
Comments
Date: 09/01/09Rank: 1Comment:

Request Information From Our Sponsors
- StockCharts.com, Inc.
- Candle Patterns
- Candlestick Charting Explained
- Intermarket Technical Analysis
- John Murphy on Chart Analysis
- John Murphy's Chart Pattern Recognition
- John Murphy's Market Message
- MurphyExplainsMarketAnalysis-Intermarket Analysis
- MurphyExplainsMarketAnalysis-Visual Analysis
- StockCharts.com
- Technical Analysis of the Financial Markets
- The Visual Investor
- VectorVest, Inc.
- Executive Premier Workshop
- One-Day Options Course
- OptionsPro
- Retirement Income Workshop
- Sure-Fire Trading Systems (VectorVest, Inc.)
- Trading as a Business Workshop
- VectorVest 7 EOD
- VectorVest 7 RealTime/IntraDay
- VectorVest AutoTester
- VectorVest Educational Services
- VectorVest OnLine
- VectorVest Options Analyzer
- VectorVest ProGraphics v6.0
- VectorVest ProTrader 7
- VectorVest RealTime Derby Tool
- VectorVest Simulator
- VectorVest Variator
- VectorVest Watchdog
