HOT TOPICS LIST
- MACD
- Fibonacci
- RSI
- Gann
- ADXR
- Stochastics
- Volume
- Triangles
- Futures
- Cycles
- Volatility
- ZIGZAG
- MESA
- Retracement
- Aroon
INDICATORS LIST
LIST OF TOPICS
PRINT THIS ARTICLE
by Donald W. Pendergast, Jr.
Compared to the record-breaking selloff in the oil markets in 2008, the 2009 rebound in crude oil might very well earn it the title of the comeback kid. Could crude be setting up for still more upside?
Position: Accumulate
Donald W. Pendergast, Jr.
Donald W. Pendergast is a financial markets consultant who offers specialized services to stock brokers and high net worth individuals who seek a better bottom line for their portfolios.
PRINT THIS ARTICLE
CHART ANALYSIS
USO Daily Breakout Needs Follow-Through
08/24/09 10:12:42 AMby Donald W. Pendergast, Jr.
Compared to the record-breaking selloff in the oil markets in 2008, the 2009 rebound in crude oil might very well earn it the title of the comeback kid. Could crude be setting up for still more upside?
Position: Accumulate
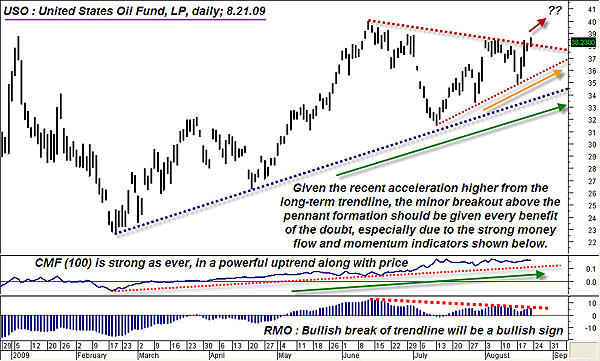
| In their own way, bull markets can be just as treacherous to trade as bear markets, mostly because the bull's job is to shake out all weak hands all the way up until the price gets so high that every trading dilettante (and we've all been there) begins to pile in just as the trend prepares to head south in a major corrective move, thus faking out the majority of small traders. And while at first glance it appears that crude oil's daily and weekly charts might be flashing such warning signs, a closer look reveals that crude may just be pausing before launching an assault on even higher price levels. The daily chart of USO, the United States Oil Fund, will be our focus of examination (Figure 1). |

|
| FIGURE 1: USO, DAILY. Breakouts from well-formed pennants in which the same chart demonstrates a powerful long-term money flow trend should be viewed as a bullish confirmation, but as always, follow-through after the breakout is the real key. |
| Graphic provided by: MetaStock. |
| |
| Many positive attributes exist here in USO's daily graph; note the very strong long-term money flow, using the Chaikin money flow (CMF)(100) indicator, which is right up near its post-crash high reading; lots of bucks are still being plowed into USO in anticipation of higher prices, and the lack of money flow divergence can only be interpreted as bullish at this stage of the chart layout. Next, witness the recent acceleration of prices from the blue long-term uptrend line along with the progressive "in-coiling" of prices, forming the well-defined pennant that thousands of other USO traders are probably also looking at right now. Finally, take a glance at the Rahul Mohindar oscillator (RMO) at the bottom of the chart; this very powerful momentum/trend indicator is still in positive territory (above its zero line) and still appears to be in general sync with the action on the price chart. Watch the downsloping red trendline on the RMO's recent peaks for further confirmation of USO's next move. As for the action on the chart itself, the recent minor breakout of the pennant is very bullish, but as always, the follow-through on the breakout is going to be the real key. Given the status of the technical elements already discussed, this is one breakout that should be given a much better than average chance of bullish follow-through. |
| World crude oil demand is likely to continue to slowly ratchet up during the next two decades, especially due to the rapid growth of the automobile and truck markets in India and China, among other places, in the world of emerging market economies. Playing USO for longer-term trend moves (using covered calls and/or short put sales) and also trading in and out of low-risk pullback setups will likely result in many successful trades over the next few years, if not more. Right now, USO could be at a critical juncture in which price could go in any direction, but over the long term, the most probable pathway for global oil prices (and for USO) is higher, perhaps substantially. The good news is that as traders we can actually put that powerful trend to good use, depending on how accurate our trading strategies are. |
Donald W. Pendergast is a financial markets consultant who offers specialized services to stock brokers and high net worth individuals who seek a better bottom line for their portfolios.
| Title: | Writer, market consultant |
| Company: | Linear Trading Systems LLC |
| Jacksonville, FL 32217 | |
| Phone # for sales: | 904-239-9564 |
| E-mail address: | lineartradingsys@gmail.com |
Traders' Resource Links | |
| Linear Trading Systems LLC has not added any product or service information to TRADERS' RESOURCE. | |
Click here for more information about our publications!
Comments
Date: 08/24/09Rank: 5Comment:

Request Information From Our Sponsors
- VectorVest, Inc.
- Executive Premier Workshop
- One-Day Options Course
- OptionsPro
- Retirement Income Workshop
- Sure-Fire Trading Systems (VectorVest, Inc.)
- Trading as a Business Workshop
- VectorVest 7 EOD
- VectorVest 7 RealTime/IntraDay
- VectorVest AutoTester
- VectorVest Educational Services
- VectorVest OnLine
- VectorVest Options Analyzer
- VectorVest ProGraphics v6.0
- VectorVest ProTrader 7
- VectorVest RealTime Derby Tool
- VectorVest Simulator
- VectorVest Variator
- VectorVest Watchdog
- StockCharts.com, Inc.
- Candle Patterns
- Candlestick Charting Explained
- Intermarket Technical Analysis
- John Murphy on Chart Analysis
- John Murphy's Chart Pattern Recognition
- John Murphy's Market Message
- MurphyExplainsMarketAnalysis-Intermarket Analysis
- MurphyExplainsMarketAnalysis-Visual Analysis
- StockCharts.com
- Technical Analysis of the Financial Markets
- The Visual Investor
