HOT TOPICS LIST
- MACD
- Fibonacci
- RSI
- Gann
- ADXR
- Stochastics
- Volume
- Triangles
- Futures
- Cycles
- Volatility
- ZIGZAG
- MESA
- Retracement
- Aroon
INDICATORS LIST
LIST OF TOPICS
PRINT THIS ARTICLE
by Chaitali Mohile
Cisco has opened a fresh buying opportunity.
Position: Buy
Chaitali Mohile
Active trader in the Indian stock markets since 2003 and a full-time writer. Trading is largely based upon technical analysis.
PRINT THIS ARTICLE
TECHNICAL INDICATORS
Cisco Remains Bullish
08/24/09 02:57:46 PMby Chaitali Mohile
Cisco has opened a fresh buying opportunity.
Position: Buy
| In my article on July 24, I mentioned various resistance levels that were converted to support in the chart of Cisco Systems (CSCO) along with the three white soldiers' candlestick pattern and a gap-up breakout. During the past few days, the stock has retraced back to the same support near $21 and has filled the small gap between $21 and $20.50. |
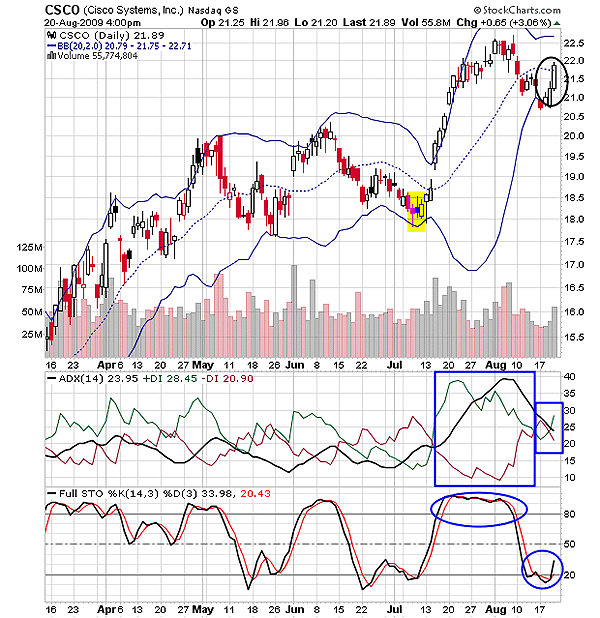
| In Figure 1, I would emphasize on trading according to the Bollinger band tool. The Bollinger band shows safe buying and selling signals as well as the breakout directions. Usually, trading between the bands accumulates good profits in the pockets which, if analyzed along with a few other chart patterns, might protect the trade. We can see that CSCO has never breached either of the Bollinger bands. In fact, the bands rush to extend the support to the price flow or have restricted the bullish breakout. |
| In June 2009, CSCO retraced to the lower Bollinger band and established support. Here, traders might have stayed on the sidelines till the price moved above the support. I would prefer one of my favorite tools, which is the candlestick pattern, to understand the trading signs. Let us start with the yellow square at the lower Bollinger band. In the block there are three candles: the pink with a small upper shadow is a hammer and the other two cumulatively form a bullish engulfing pattern. Both the candlestick patterns are bullish reversals, initiating a fresh upward rally. Later, the center line of the Bollinger band was violated by a small gap up and the stock climbed higher. The bullish rally rushed along the upper Bollinger band, forming the three white soldiers' candlestick pattern. Thereafter, the upper Bollinger band surged higher as price moved sideways. |

|
| FIGURE 1: CSCO, DAILY |
| Graphic provided by: StockCharts.com. |
| |
| In early August 2009, CSCO corrected, violating the support of the center line of the band. The highly bullish indicators in Figure 1 suggested the possibility of this intermediate correction. As the stock plunged, I anticipated a bearish breakout of the lower band. If this had happened, the stock would have corrected another few points. But the full stochastic (14,3,3) surged from the oversold area above 20 levels, and the average directional movement index (ADX) (14) turned in the bull's favor as the buying pressure improved. These bullish reversal indications stopped the bearish move and helped CSCO to establish support at the lower Bollinger band. As a result, a significant upward rally with the support was born. This is the good buying opportunity initially with the target of an upper Bollinger band. The two long white candles suggest the possibility of a three white soldiers candlestick formation, if the third day is bullish as well. |
| The indicators are very well situated to carry CSCO higher. The stock continues to remain in a bullish mood. |
Active trader in the Indian stock markets since 2003 and a full-time writer. Trading is largely based upon technical analysis.
| Company: | Independent |
| Address: | C1/3 Parth Indraprasth Towers. Vastrapur |
| Ahmedabad, Guj 380015 | |
| E-mail address: | chaitalimohile@yahoo.co.in |
Traders' Resource Links | |
| Independent has not added any product or service information to TRADERS' RESOURCE. | |
Click here for more information about our publications!
Comments
Date: 08/24/09Rank: 2Comment:

Request Information From Our Sponsors
- StockCharts.com, Inc.
- Candle Patterns
- Candlestick Charting Explained
- Intermarket Technical Analysis
- John Murphy on Chart Analysis
- John Murphy's Chart Pattern Recognition
- John Murphy's Market Message
- MurphyExplainsMarketAnalysis-Intermarket Analysis
- MurphyExplainsMarketAnalysis-Visual Analysis
- StockCharts.com
- Technical Analysis of the Financial Markets
- The Visual Investor
- VectorVest, Inc.
- Executive Premier Workshop
- One-Day Options Course
- OptionsPro
- Retirement Income Workshop
- Sure-Fire Trading Systems (VectorVest, Inc.)
- Trading as a Business Workshop
- VectorVest 7 EOD
- VectorVest 7 RealTime/IntraDay
- VectorVest AutoTester
- VectorVest Educational Services
- VectorVest OnLine
- VectorVest Options Analyzer
- VectorVest ProGraphics v6.0
- VectorVest ProTrader 7
- VectorVest RealTime Derby Tool
- VectorVest Simulator
- VectorVest Variator
- VectorVest Watchdog
