HOT TOPICS LIST
- MACD
- Fibonacci
- RSI
- Gann
- ADXR
- Stochastics
- Volume
- Triangles
- Futures
- Cycles
- Volatility
- ZIGZAG
- MESA
- Retracement
- Aroon
INDICATORS LIST
LIST OF TOPICS
PRINT THIS ARTICLE
by Chaitali Mohile
Ever since the Utility Select SPDR began its bullish journey, the sector moved in a steady rhythm in an ascending channel. The movement within the channel has allowed perfect entry-exits for the traders. Let's look at the current one.
Position: Buy
Chaitali Mohile
Active trader in the Indian stock markets since 2003 and a full-time writer. Trading is largely based upon technical analysis.
PRINT THIS ARTICLE
TECHNICAL ANALYSIS
XLU Has More Upper Space
08/24/09 02:41:23 PMby Chaitali Mohile
Ever since the Utility Select SPDR began its bullish journey, the sector moved in a steady rhythm in an ascending channel. The movement within the channel has allowed perfect entry-exits for the traders. Let's look at the current one.
Position: Buy
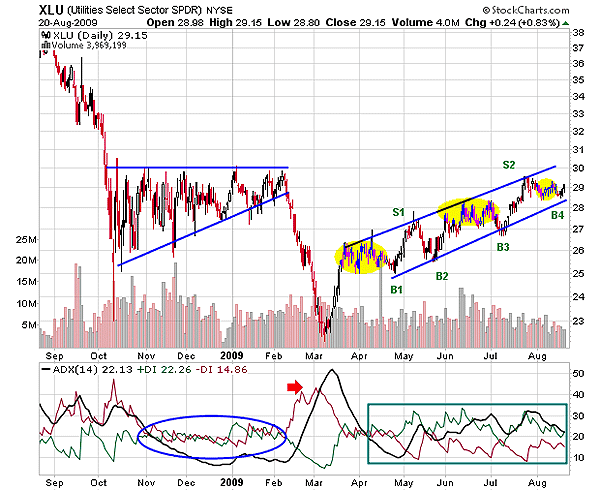
| The years 2007-08 saw one of the worst corrections in the global financial markets. Most of the indexes and the sectors plunged to their make-or-break supports. One was the Utility Select Sector SPDR (XLU). XLU turned down the ascending triangular formation that is seen as a trend reversal pattern in a downtrend. In Figure 1, the ascending triangle was formed at the end of 2008. Since the pattern took almost three months to get built up, it is considered a long-term pattern and therefore most reliable. But the power of the bears was stronger and intense than the pattern, and as a result, the reversal pattern failed and XLU resumed its prior declining rally. The bearish breakout witnessed a steep vertical fall without giving buyers any time to think. The selling pressure increased dramatically. |

|
| FIGURE 1: XLU, DAILY. The ADX (14) signifies the developing uptrend during the recent upward journey from the lower trendline. The chart shows only two accurate selling points, S1 and S2. |
| Graphic provided by: StockCharts.com. |
| |
| The average directional movement index (ADX) (14) in Figure 1 at the end of 2008 indicated consolidations by moving much below the 20 levels and the positive directional index (+DI) and negative directional index (-DI) undergoing a tough battle. The blue oval in Figure 1 reflects the consolidation phase of XLU. Later, the -DI conquered over the +DI and the trend surged in a bearish fashion (see the red arrow). Due to the overheated downtrend above 45 levels, XLU witnessed a sharp V-shaped recovery and gradually formed higher highs and higher lows. These rhythmic movements initiated an ascending channel -- a bullish formation that shields not only the buyers but also the sellers. |
| However, the entry points (B1, B2, B3) from the lower trendline are considered genuine and prominent as there was steady upward price action, whereas the downside rally from the upper trendline was more volatile as they changed the directions before hitting the lower trendline (see the yellow block). According to Figure 1, XLU has recently surged from the lower trendline, offering one more low-risk entry point (B4) for traders. The upper trendline intercepts at 30 levels, marking it as the potential target for the current rally. The closer look of the daily chart would provide the details for the trade. |

|
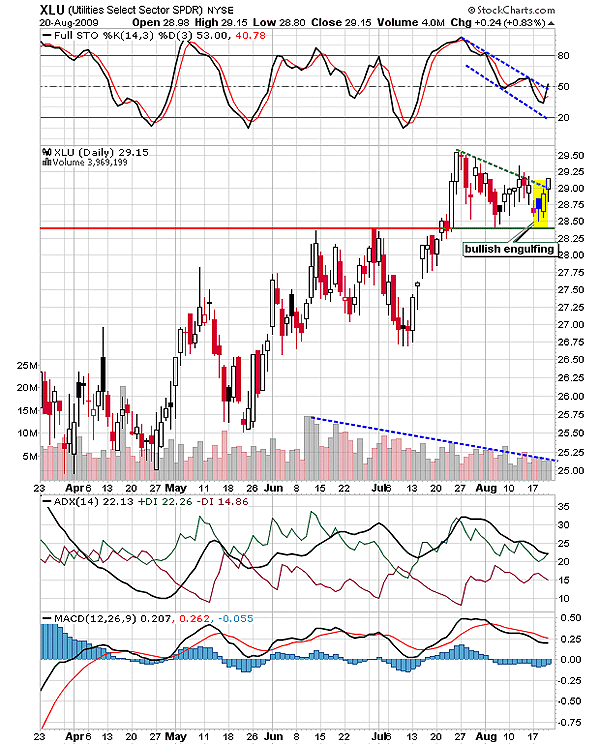
| FIGURE 2: XLU, DAILY. The support-resistance tool line shows strong support established by converting the previous high resistance to the support. |
| Graphic provided by: StockCharts.com. |
| |
| We have already seen that XLU has surged from the lower trendline. Figure 2 shows a bullish reversal candlestick pattern at the bottom, a bullish engulfing pattern (probably with the support of the lower trendline) that has initiated a breakout rally. XLU has converted the prior peaks to the support and moved sideways with a marginal descent. As a result, a pennant has been formed. The bullish consolidation pattern -- a flag pennant pattern is already on the verge to break out upward. In Figure 1, the full stochastic (14,3,3) formed a bearish channel due to the lower lows and lower highs from an overbought area. Currently, the oscillator shows the possibility of a fresh bullish rally by moving above the 50 levels. |
| The ADX (14) is indicating a steadily developing uptrend, and the moving average convergence/divergence (MACD) (12,26,9) has been rallying in positive territory. Therefore, the bullish scene might soon signal a confirmed breakout of the bullish flag & pennant pattern in Figure 2. The only thing that is worrisome is the declining volume. The shrinking volume might slow down the breakout rally or might induce high volatility as well. Thus, a high-volume breakout is the most essential feature for the XLU's breakout. The sector has a large upper space for the rally to move ($30 target), and therefore, traders should not miss the opportunity to enter this sector. Hence, the big picture of XLU is positive and reliable. |
Active trader in the Indian stock markets since 2003 and a full-time writer. Trading is largely based upon technical analysis.
| Company: | Independent |
| Address: | C1/3 Parth Indraprasth Towers. Vastrapur |
| Ahmedabad, Guj 380015 | |
| E-mail address: | chaitalimohile@yahoo.co.in |
Traders' Resource Links | |
| Independent has not added any product or service information to TRADERS' RESOURCE. | |
Click here for more information about our publications!
Comments

Request Information From Our Sponsors
- VectorVest, Inc.
- Executive Premier Workshop
- One-Day Options Course
- OptionsPro
- Retirement Income Workshop
- Sure-Fire Trading Systems (VectorVest, Inc.)
- Trading as a Business Workshop
- VectorVest 7 EOD
- VectorVest 7 RealTime/IntraDay
- VectorVest AutoTester
- VectorVest Educational Services
- VectorVest OnLine
- VectorVest Options Analyzer
- VectorVest ProGraphics v6.0
- VectorVest ProTrader 7
- VectorVest RealTime Derby Tool
- VectorVest Simulator
- VectorVest Variator
- VectorVest Watchdog
- StockCharts.com, Inc.
- Candle Patterns
- Candlestick Charting Explained
- Intermarket Technical Analysis
- John Murphy on Chart Analysis
- John Murphy's Chart Pattern Recognition
- John Murphy's Market Message
- MurphyExplainsMarketAnalysis-Intermarket Analysis
- MurphyExplainsMarketAnalysis-Visual Analysis
- StockCharts.com
- Technical Analysis of the Financial Markets
- The Visual Investor
