HOT TOPICS LIST
- MACD
- Fibonacci
- RSI
- Gann
- ADXR
- Stochastics
- Volume
- Triangles
- Futures
- Cycles
- Volatility
- ZIGZAG
- MESA
- Retracement
- Aroon
INDICATORS LIST
LIST OF TOPICS
PRINT THIS ARTICLE
by Ron Walker
In an article I wrote in July 2009, I addressed the need for closure in order to confirm the complex head & shoulders pattern that was setting up. That pattern failed due to an 11th-hour decision to change course by the bulls. So the deal was never officially sealed on that particular reversal pattern. But since then a new bearish pattern has formed. Or has it?
Position: N/A
Ron Walker
Ron Walker is an active trader and technical analyst. He operates an educational website dedicated to the study of Technical Analysis. The website offers free market analysis with daily video presentations and written commentaries. Ron is a video pioneer, being one of the first to utilize the internet producing Technical Analysis videos. His website is thechartpatterntrader.com
PRINT THIS ARTICLE
BROADENING FORMATION
The Broadening Formation On The S&P 500
08/21/09 10:21:32 AMby Ron Walker
In an article I wrote in July 2009, I addressed the need for closure in order to confirm the complex head & shoulders pattern that was setting up. That pattern failed due to an 11th-hour decision to change course by the bulls. So the deal was never officially sealed on that particular reversal pattern. But since then a new bearish pattern has formed. Or has it?
Position: N/A
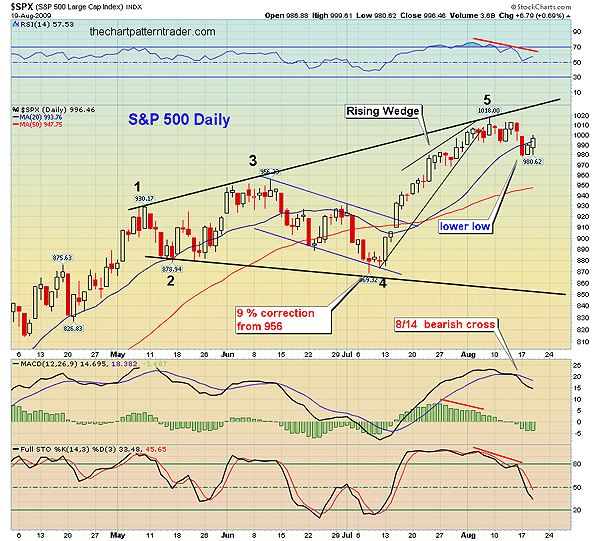
| From the July low of 869, the Standard & Poor's 500 has aggressively risen by 17.25%, causing the potential complex head & shoulders pattern to fail. This runup has allowed another bearish pattern to set up, a five-point broadening formation (Figure 1). Often, when a head & shoulders pattern fails, it signals the end of an advance approaching. Analyst and author John Magee made an important observation about head & shoulders topping patterns: that a head & shoulders formation that does not work is a warning that even though there is still some life in the situation, a genuine turn is near. The next time something in the nature of a reversal pattern begins to appear on the charts, it is apt to be final. That could be the case here on the S&P 500. The head & shoulders pattern may have been negated, postponing judgment until the broadening formation had a chance to conclude. |

|
| FIGURE 1: SPX, DAILY. The third peak on this broadening formation reveals that prices could not push above the rising trendline of resistance. Shortly after the MACD got a bearish cross, a reaction was produced that led to a lower low as prices fell below the 20-day SMA. In addition, note the 9% correction from the prior peak of 956. |
| Graphic provided by: StockCharts.com. |
| |
| Many investors are now wondering if the long overdue correction will manifest itself, questioning if a top has truly been made. The bears have been asking in unison, "Are we there yet?" That in itself suggests a certain amount of complacency at these levels. Keep in mind that from the June high of 956 to the July low of 869 was only a 9% correction for the S&P 500 (see Figure 1). This is not much of a correction, considering that from the March lows to the August highs, the S&P 500 climbed 53% in less than six months. That gives our broadening formation a heightened sense of importance because it can bring a possible long-term correction. In Figure 1, the S&P 500 is sporting a five-point orthodox broadening formation, clearly with three peaks, each higher than the next, and two bottoms with the second lower than the first. After the reaction began from the third peak, prices began to drift sideways. But on August 14, the moving average convergence/divergence (MACD) (12, 26, 9) crossed below its signal line, and the following trading session prices broke below support and put in a lower low, confirming that bearish signal. The daily chart now has a lower high and a lower low, which is what defines a declining trend. However, the appearance of the broadening formation presents a bit of a quandary. This pattern can actually act as a continuation or a reversal pattern. And it is too early to know which path the pattern will take. |
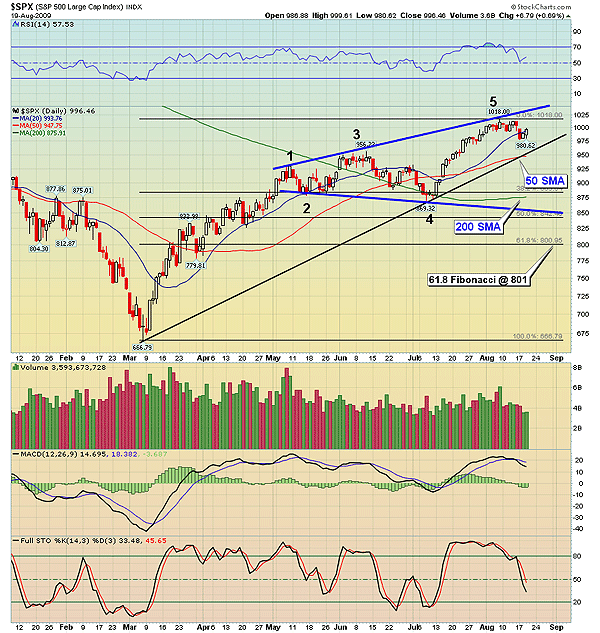
| If the broadening formation is a continuation pattern, the lower trendline of the pattern should contain this next correction either near the 950 level or above the lowest low of the formation near 869 (the pivot point). If either one of those levels of support holds up, prices will gradually begin to rise back up to the highest high of the pattern, then eventually go on to make new highs. But if the broadening formation is a reversal pattern, then look out below. The pattern measures 149 points to a target of 720, which will give back most of the gains that have been made from the March low. That target would also move prices well below the 61.8% Fibonacci retracement from the March low coming in at 801, as seen on the S&P 500 daily chart in Figure 2. For downward breakout of this pattern, take the difference between the highest high (1018) and the lowest low in pattern (869). By taking the difference (149 points) and subtracting it from the lowest low of the pattern, we get the minimum price target. Here's the math if the pattern turns out to be a reversal: 1018 (highest high) - 869 (lowest low) = 149 points 869 (lowest low) - 149 (difference) = 720 (minimum price target) |

|
| FIGURE 2: SPX, DAILY. This chart shows a series of support levels. The 50- and 200-day SMAs are candidates were buyers to come in. The rising trendline is the key level of support. If it breaks the 200-day SMA, the lower boundary of formation and the 61.8 % Fibonacci retracement offer the next levels of support. |
| Graphic provided by: StockCharts.com. |
| |
| Assuming that prices are in the early stages of a correction, we should focus our attention on the rising trendline that has formed in the July lows (Figure 2). If it holds, it will be the third touch of the rising trendline and possibly establish a new intermediate trendline. The trendline is hovering near the 50-day simple moving average (SMA), which is an important level of support. If prices bounce off the trendline, the broadening formation may turn out to be a continuation pattern. But if the trendline is fractured, the bearish repercussions of the broadening formation will prevail over the market during the autumn, which would add credibility to the reversal scenario. Even if the rising trendline breaks, and prices skid down to the lower boundary of the pattern, it still could act as a continuation pattern. However, the lower boundary must remain intact. In Figure 2, the 200-day is fairly close to the lower boundary, which could also halt the selloff. |
| If the lower boundary of the pattern fails to stop the selling, the bearish forces of the broadening formation will begin to take root and reverse much of the advance that has occurred. So if this pattern proves to be a reversal, it will activate an autodestruct sequence in the market. In conclusion, should prices dip below the lower boundary of the formation, seasonal trends could take over. Periods of distribution often occur in the autumn months of September and early October, which might further exacerbate the situation. |
Ron Walker is an active trader and technical analyst. He operates an educational website dedicated to the study of Technical Analysis. The website offers free market analysis with daily video presentations and written commentaries. Ron is a video pioneer, being one of the first to utilize the internet producing Technical Analysis videos. His website is thechartpatterntrader.com
| Website: | thechartpatterntrader.com |
| E-mail address: | thechartpatterntrader@gmail.com |
Click here for more information about our publications!
Comments
Date: 08/24/09Rank: 4Comment:

Request Information From Our Sponsors
- StockCharts.com, Inc.
- Candle Patterns
- Candlestick Charting Explained
- Intermarket Technical Analysis
- John Murphy on Chart Analysis
- John Murphy's Chart Pattern Recognition
- John Murphy's Market Message
- MurphyExplainsMarketAnalysis-Intermarket Analysis
- MurphyExplainsMarketAnalysis-Visual Analysis
- StockCharts.com
- Technical Analysis of the Financial Markets
- The Visual Investor
- VectorVest, Inc.
- Executive Premier Workshop
- One-Day Options Course
- OptionsPro
- Retirement Income Workshop
- Sure-Fire Trading Systems (VectorVest, Inc.)
- Trading as a Business Workshop
- VectorVest 7 EOD
- VectorVest 7 RealTime/IntraDay
- VectorVest AutoTester
- VectorVest Educational Services
- VectorVest OnLine
- VectorVest Options Analyzer
- VectorVest ProGraphics v6.0
- VectorVest ProTrader 7
- VectorVest RealTime Derby Tool
- VectorVest Simulator
- VectorVest Variator
- VectorVest Watchdog
