HOT TOPICS LIST
- MACD
- Fibonacci
- RSI
- Gann
- ADXR
- Stochastics
- Volume
- Triangles
- Futures
- Cycles
- Volatility
- ZIGZAG
- MESA
- Retracement
- Aroon
INDICATORS LIST
LIST OF TOPICS
PRINT THIS ARTICLE
by Chaitali Mohile
The bank index and the related stocks have been rising as the RSI was descending. What does that suggest?
Position: N/A
Chaitali Mohile
Active trader in the Indian stock markets since 2003 and a full-time writer. Trading is largely based upon technical analysis.
PRINT THIS ARTICLE
TECHNICAL INDICATORS
The Declining Indicator
08/20/09 12:32:28 PMby Chaitali Mohile
The bank index and the related stocks have been rising as the RSI was descending. What does that suggest?
Position: N/A
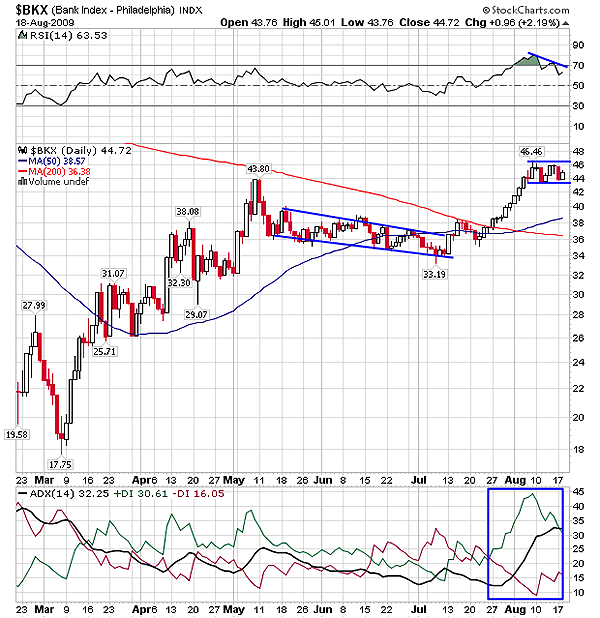
| The bullish rally of the bank index ($BKX) turned sideways for a longer period under the resistance of the 200-day moving average (MA). The descending path moved in a highly narrow range. The volatility was at its peak during the descent as the buying and the selling pressures converged. The average directional movement index (ADX) (14) in Figure 1 shows the positive directional index (+DI) and the negative directional index (-DI) coming together and the indicator turning weaker. Therefore, the bearish consolidation was very well indicated by the ADX (14). Another reason for the volatile sideways action was the shaky relative strength index (RSI) (14). |

|
| FIGURE 1: $BKX, DAILY |
| Graphic provided by: StockCharts.com. |
| |
| The RSI (14) managed to stop further descent by establishing support near the 30 levels and simultaneously forming a higher low, indicating bullish sentiments for the possible breakout of the descending channel. As a result, the price surged above the upper range but struggled to violate the 200-day MA resistance. Later, the breakout rally gained strength and $BKX rushed to the higher levels. With this breakout, the weak trend reversed in a bullish direction, adding buying pressure on the rally. In Figure 1, we can see that the index is again consolidating but horizontally, forming a bullish flag & pennant pattern. Since the overbought RSI (14) formed a lower high, $BKX entered the sideways consolidation. Now the point of concern is whether the bullish continuation pattern will break out or fail due to the negative divergence by the RSI (14). |

|
| FIGURE 2: BAC, DAILY |
| Graphic provided by: StockCharts.com. |
| |
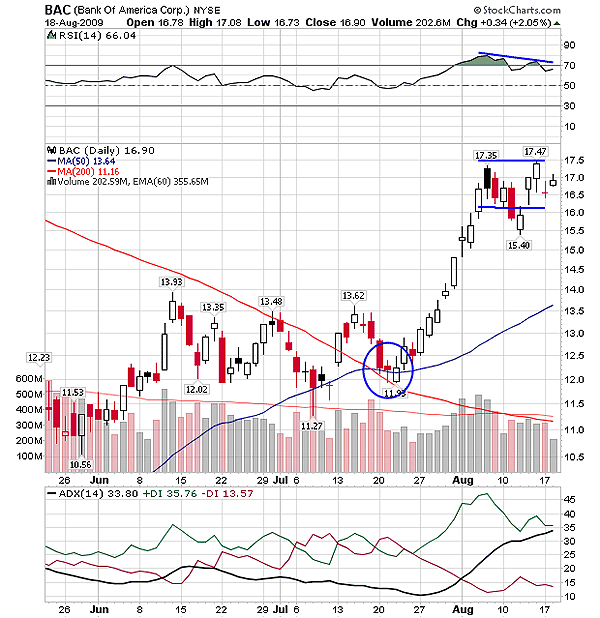
| If you consider the depth of the lower highs of the RSI (14), you can see that the indicator is still in an overbought area above the 60 levels. Currently, the oscillator is not indicating any further bearish move. In addition, the ADX (14) is signifying a well-developed uptrend. Therefore, $BKX would definitely undergo a bullish breakout but it might be a little slow. The fresh volatility in the global market might hold back the fast movement of the certain indexes. In addition, $BKX is directly related to the rallies in financial markets. Financial stocks such as Bank of America (BAC), General Electric (GE), and Citigroup (C) should be watched during the index breakout. |

|
| FIGURE 3: GE, DAILY |
| Graphic provided by: StockCharts.com. |
| |
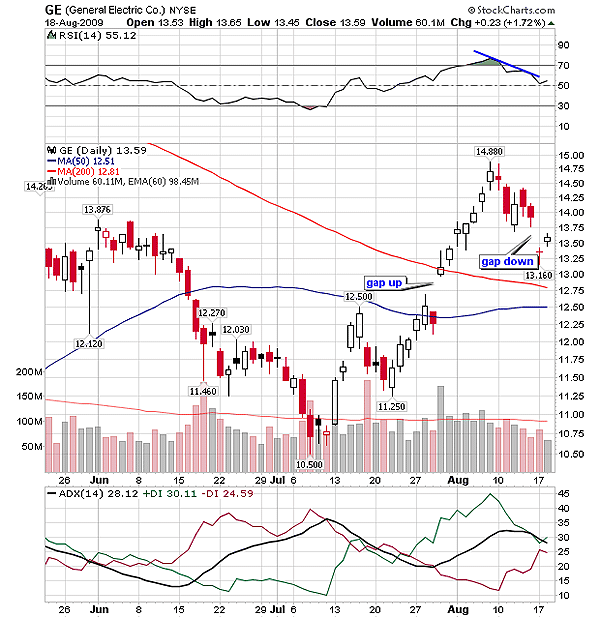
| BAC is a perfect image of the $BKX, but the other two are pretty volatile stocks. The index breakout would bring robust demand for BAC. The similar flag & pennant bullish continuation pattern is formed in Figure 2. The target of the breakout can be measured by adding the length of the flag pole to the breakout level. But the breakout should be confirmed before initiating any long trades. GE witnessed a steep fall (Figure 3) with the gap down acting as a catalyst to the fall. Earlier, the stock gapped up, converting the 200-day MA resistance to support and rallied higher. The RSI (14) showed robust bullish strength in the rally and reached an overbought zone. The price movement of GE turned bearish immediately after the lower highs of the RSI (14). Currently, the momentum oscillator has surged establishing support at 50 levels, indicating a fresh bullish rally and offering new long positions. The ADX (14) moved steadily above 25 levels, indicating a developing uptrend. The uptrend remained intact during the reactive movement of the GE. |

|
| FIGURE 4: C, DAILY |
| Graphic provided by: StockCharts.com. |
| |
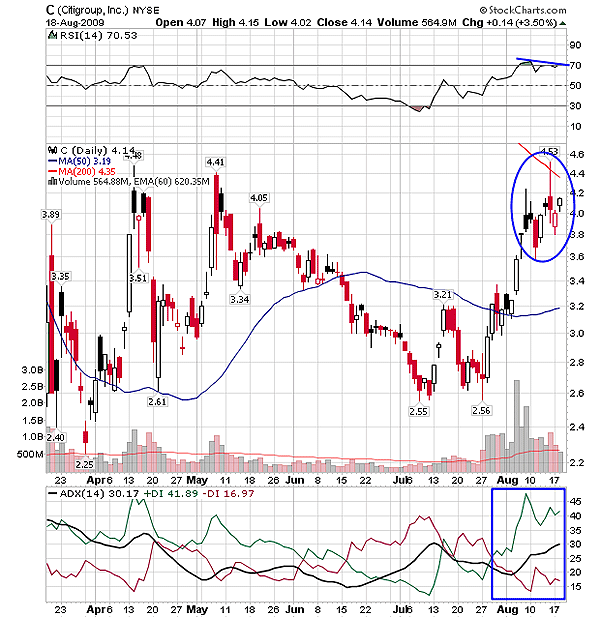
| C is the weakest of all, as it has hit two strong resistance points, the 200-day MA and the previous high (see Figure 4). This stock has also formed higher highs, while the RSI (14) formed lower highs. Although the trend is bullish and the RSI (14) has sustained in an overbought region, traders should wait for the confirmed breakout above various resistance on the daily chart in Figure 4. Thus, traders might get safe entry points after the $BKX breakout. |
Active trader in the Indian stock markets since 2003 and a full-time writer. Trading is largely based upon technical analysis.
| Company: | Independent |
| Address: | C1/3 Parth Indraprasth Towers. Vastrapur |
| Ahmedabad, Guj 380015 | |
| E-mail address: | chaitalimohile@yahoo.co.in |
Traders' Resource Links | |
| Independent has not added any product or service information to TRADERS' RESOURCE. | |
Click here for more information about our publications!
Comments
Date: 08/20/09Rank: 1Comment:

|

Request Information From Our Sponsors
- StockCharts.com, Inc.
- Candle Patterns
- Candlestick Charting Explained
- Intermarket Technical Analysis
- John Murphy on Chart Analysis
- John Murphy's Chart Pattern Recognition
- John Murphy's Market Message
- MurphyExplainsMarketAnalysis-Intermarket Analysis
- MurphyExplainsMarketAnalysis-Visual Analysis
- StockCharts.com
- Technical Analysis of the Financial Markets
- The Visual Investor
- VectorVest, Inc.
- Executive Premier Workshop
- One-Day Options Course
- OptionsPro
- Retirement Income Workshop
- Sure-Fire Trading Systems (VectorVest, Inc.)
- Trading as a Business Workshop
- VectorVest 7 EOD
- VectorVest 7 RealTime/IntraDay
- VectorVest AutoTester
- VectorVest Educational Services
- VectorVest OnLine
- VectorVest Options Analyzer
- VectorVest ProGraphics v6.0
- VectorVest ProTrader 7
- VectorVest RealTime Derby Tool
- VectorVest Simulator
- VectorVest Variator
- VectorVest Watchdog
