HOT TOPICS LIST
- MACD
- Fibonacci
- RSI
- Gann
- ADXR
- Stochastics
- Volume
- Triangles
- Futures
- Cycles
- Volatility
- ZIGZAG
- MESA
- Retracement
- Aroon
INDICATORS LIST
LIST OF TOPICS
PRINT THIS ARTICLE
by Mike Carr, CMT
Many analysts claim that Chinese stocks lead the world markets at major turning points. The chart says that's true -- at least one time.
Position: N/A
Mike Carr, CMT
Mike Carr, CMT, is a member of the Market Technicians Association, and editor of the MTA's newsletter, Technically Speaking. He is also the author of "Smarter Investing in Any Economy: The Definitive Guide to Relative Strength Investing," and "Conquering the Divide: How to Use Economic Indicators to Catch Stock Market Trends."
PRINT THIS ARTICLE
STRATEGIES
Does China Lead The Way?
08/19/09 09:11:27 AMby Mike Carr, CMT
Many analysts claim that Chinese stocks lead the world markets at major turning points. The chart says that's true -- at least one time.
Position: N/A
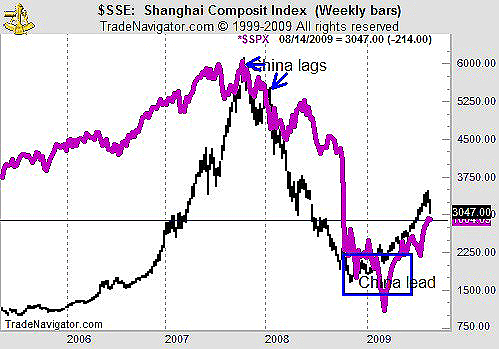
| As the Shanghai Composite Index ($SSE) fell by more than 12% the week of August 10, the talking heads came out proclaiming that this was a leading indicator of bad times for US stocks. The evidence they cited was that the $SSE bottomed before the Dow Jones Industrial Average (DJIA) in March 2009. And, as all traders know, one time makes a statistically significant sample size if the point is interesting enough to the anchors on CNBC and Bloomberg TV. |
| Figure 1 shows that China did indeed bottom ahead of the US earlier this year. It also shows that the US topped first in 2007 and 2008. In fact, a visual examination of that chart reveals that the US led at almost every significant turn. |

|
| FIGURE 1: $SSE, WEEKLY. Intermarket relationships change over time. |
| Graphic provided by: Trade Navigator. |
| |
| This does not mean that the US leads China. What it does mean is that sometimes an intermarket relationship will work and sometimes it won't. In the end, traders need to act on the weight of the evidence and not any single indicator. |
Mike Carr, CMT, is a member of the Market Technicians Association, and editor of the MTA's newsletter, Technically Speaking. He is also the author of "Smarter Investing in Any Economy: The Definitive Guide to Relative Strength Investing," and "Conquering the Divide: How to Use Economic Indicators to Catch Stock Market Trends."
| Website: | www.moneynews.com/blogs/MichaelCarr/id-73 |
| E-mail address: | marketstrategist@gmail.com |
Click here for more information about our publications!
Comments
Date: 08/19/09Rank: 1Comment:

Request Information From Our Sponsors
- StockCharts.com, Inc.
- Candle Patterns
- Candlestick Charting Explained
- Intermarket Technical Analysis
- John Murphy on Chart Analysis
- John Murphy's Chart Pattern Recognition
- John Murphy's Market Message
- MurphyExplainsMarketAnalysis-Intermarket Analysis
- MurphyExplainsMarketAnalysis-Visual Analysis
- StockCharts.com
- Technical Analysis of the Financial Markets
- The Visual Investor
- VectorVest, Inc.
- Executive Premier Workshop
- One-Day Options Course
- OptionsPro
- Retirement Income Workshop
- Sure-Fire Trading Systems (VectorVest, Inc.)
- Trading as a Business Workshop
- VectorVest 7 EOD
- VectorVest 7 RealTime/IntraDay
- VectorVest AutoTester
- VectorVest Educational Services
- VectorVest OnLine
- VectorVest Options Analyzer
- VectorVest ProGraphics v6.0
- VectorVest ProTrader 7
- VectorVest RealTime Derby Tool
- VectorVest Simulator
- VectorVest Variator
- VectorVest Watchdog
