HOT TOPICS LIST
- MACD
- Fibonacci
- RSI
- Gann
- ADXR
- Stochastics
- Volume
- Triangles
- Futures
- Cycles
- Volatility
- ZIGZAG
- MESA
- Retracement
- Aroon
INDICATORS LIST
LIST OF TOPICS
PRINT THIS ARTICLE
by Alan R. Northam
The stock market has now entered into a market correction. There are those market participants that are calling for the end of the upward rally at this price juncture and those who forecast the market will continue higher. Let's look at the technicals to see what the market is saying.
Position: N/A
Alan R. Northam
Alan Northam lives in the Dallas, Texas area and as an electronic engineer gave him an analytical mind from which he has developed a thorough knowledge of stock market technical analysis. His abilities to analyze the future direction of the stock market has allowed him to successfully trade of his own portfolio over the last 30 years. Mr. Northam is now retired and trading the stock market full time. You can reach him at inquiry@tradersclassroom.com or by visiting his website at http://www.tradersclassroom.com. You can also follow him on Twitter @TradersClassrm.
PRINT THIS ARTICLE
Stock Market Corrects
08/18/09 09:14:39 AMby Alan R. Northam
The stock market has now entered into a market correction. There are those market participants that are calling for the end of the upward rally at this price juncture and those who forecast the market will continue higher. Let's look at the technicals to see what the market is saying.
Position: N/A
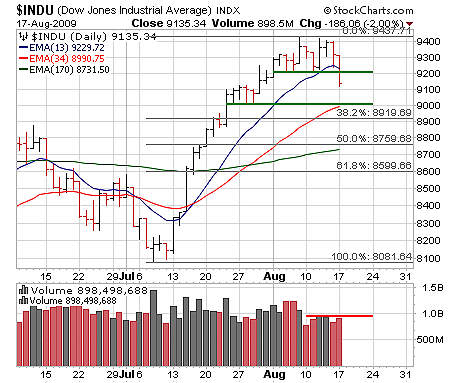
| Figure 1 is that of the daily bar chart of the Dow Jones Industrial Average (DJIA) over the last two months. The chart in this figure shows the latest short-term rally that started in early July when the price bars broke out above the 13-day exponential moving average (EMA). Short-term rallies normally last from a few days to a few weeks, with this rally lasting 24 days or almost five weeks from breakout to breakdown. |

|
| FIGURE 1: DJIA, DAILY. This chart shows moving averages, horizontal support levels, and the Fibonacci retracement levels. |
| Graphic provided by: StockCharts.com. |
| |
| On August 17, 2009, the DJIA broke below the support shelf it had been building over the last nine days, signaling that the DJIA had now entered into a downward trend. The DJIA also broke below its 13-day exponential moving average (EMA), signaling that this new downward trend is short term in nature. The next level of support comes at the 9000 level, where the DJIA will meet up with a horizontal support line as well as support from the 34-day EMA. In addition, there is further support just below 9000 at 8900, where the Fibonacci 38.2% retracement price level comes into play. When multiple lines of support all converge on a common price point, a stronger wall of support is built up over single lines of support. Thus, 8900 to 9000 could be a good price range for the current short-term correction to end. |
| Below the price chart is the volume bar chart. This chart shows that selling volume was below volume resistance over the last six trading sessions. This signals weak selling volume. The significance of this weak volume is that it signals the downward breakout in price as most likely being corrective in nature and not the beginning of a larger downward trend. |
| In conclusion, the stock market as measured by the DJIA has entered into a short-term market correction. This market correction should terminate somewhere around 9000, if not at a higher price level. As long as the DJIA remains above the 34-day EMA, the correction should be short-lived. However, a break below the 34-day EMA will signal a much deeper market correction. |
Alan Northam lives in the Dallas, Texas area and as an electronic engineer gave him an analytical mind from which he has developed a thorough knowledge of stock market technical analysis. His abilities to analyze the future direction of the stock market has allowed him to successfully trade of his own portfolio over the last 30 years. Mr. Northam is now retired and trading the stock market full time. You can reach him at inquiry@tradersclassroom.com or by visiting his website at http://www.tradersclassroom.com. You can also follow him on Twitter @TradersClassrm.
| Garland, Tx | |
| Website: | www.tradersclassroom.com |
| E-mail address: | inquiry@tradersclassroom.com |
Click here for more information about our publications!
Comments
Date: 08/18/09Rank: 5Comment:

Request Information From Our Sponsors
- VectorVest, Inc.
- Executive Premier Workshop
- One-Day Options Course
- OptionsPro
- Retirement Income Workshop
- Sure-Fire Trading Systems (VectorVest, Inc.)
- Trading as a Business Workshop
- VectorVest 7 EOD
- VectorVest 7 RealTime/IntraDay
- VectorVest AutoTester
- VectorVest Educational Services
- VectorVest OnLine
- VectorVest Options Analyzer
- VectorVest ProGraphics v6.0
- VectorVest ProTrader 7
- VectorVest RealTime Derby Tool
- VectorVest Simulator
- VectorVest Variator
- VectorVest Watchdog
- StockCharts.com, Inc.
- Candle Patterns
- Candlestick Charting Explained
- Intermarket Technical Analysis
- John Murphy on Chart Analysis
- John Murphy's Chart Pattern Recognition
- John Murphy's Market Message
- MurphyExplainsMarketAnalysis-Intermarket Analysis
- MurphyExplainsMarketAnalysis-Visual Analysis
- StockCharts.com
- Technical Analysis of the Financial Markets
- The Visual Investor
