HOT TOPICS LIST
- MACD
- Fibonacci
- RSI
- Gann
- ADXR
- Stochastics
- Volume
- Triangles
- Futures
- Cycles
- Volatility
- ZIGZAG
- MESA
- Retracement
- Aroon
INDICATORS LIST
LIST OF TOPICS
PRINT THIS ARTICLE
by David Penn
"It's just an oversold rally ... a bear market rally is all ..."
Position: N/A
David Penn
Technical Writer for Technical Analysis of STOCKS & COMMODITIES magazine, Working-Money.com, and Traders.com Advantage.
PRINT THIS ARTICLE
BULL/BEAR MARKET
Bear Market Rallies and their Discontents
10/08/01 09:13:57 AMby David Penn
"It's just an oversold rally ... a bear market rally is all ..."
Position: N/A
| Aside perhaps from the loveable Toto, those who pull back curtains to reveal the hunched-over, balding schemers pretending to be wizards are not exactly the most popular folks in the Emerald City. When things have been bad, and gotten worse, what is more aggravating than running into someone who suggests, as things start to improve, that the improvement is short-lived, that bad news has only momentarily abated, that what appear temporarily to be blue skies is really simply the eye of the hurricane. But some things don't lie. And if you are a technically inclined trader, investor or analyst, price and volume are chief among them. | ||||||||||||||||||
| I bring up price and volume because the huge rally in stocks, particularly in the Nasdaq market, that came after the Federal Reserve Board's ninth rate cut seems unsustainable and price and volume are the reasons why. One of the most original tenets in technical analysis is that while stock prices can fall with or without large shifts in volume, rising stock prices must be accomapanied by rising volume in order to be sustained. When stocks rise on declining volume, one of the biggest red flags in technical analysiss will likely be flapping wildly in the wind for any who care to take notice. | ||||||||||||||||||

| ||||||||||||||||||
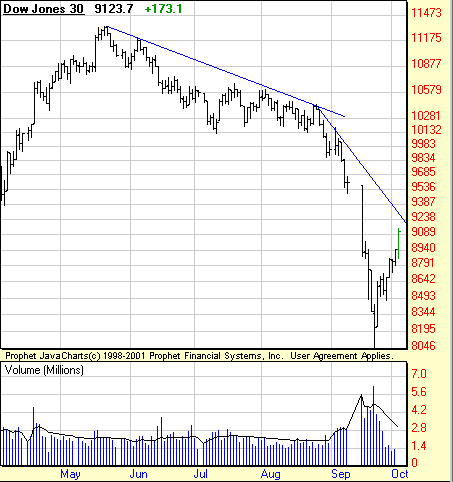
| Rising stocks and declining volume make for an unstable combination for those on the long side. | ||||||||||||||||||
| Graphic provided by: Prophet Finance. | ||||||||||||||||||
| | ||||||||||||||||||
| Unfortunately, the present rally (widely referred to as--if not treated like--an oversold rally) is a classic example of stock prices rising on declining volume. In the Nasdaq in particular, the rally has been significant in price terms, but the absence of increasing volume, the additional demand needed to keep prices moving upwards, quite frankly dooms this rally, as it dooms all rallies that come on declining volume. It has been said that volume is the gas that powers the engine that drives stock prices up. If that is so, then what can be said of an engine that appears to be working harder on less and less fuel? | ||||||||||||||||||
The chart of the Dow Jones Industrials (the recent rally was widely believed to benefit both blue chips and tech stocks--truly odd bedfellows in a bear market such as this)--shows this development quite clearly. After reaching major lows on large volume following the September 11th terrorist attacks, the Dow began a steady climb back out of the hole. Falling to less than 8300 on September 21st, the Dow rose to close above 9100 by October 3rd--an increase of almost 10% in less than ten days. The problem with this move was that volume was not along for the ride.
| ||||||||||||||||||
| In a bear market, this sort of declining volume on a rally should be expected, as should this rally's failure upon encountering signficant resistance (in the Dow, that resistance is around 9250, note the downtrend line). There is also a gap caused from the initial post-September 11th drop that is likely to prove difficult to surmount as well. |
Technical Writer for Technical Analysis of STOCKS & COMMODITIES magazine, Working-Money.com, and Traders.com Advantage.
| Title: | Technical Writer |
| Company: | Technical Analysis, Inc. |
| Address: | 4757 California Avenue SW |
| Seattle, WA 98116 | |
| Phone # for sales: | 206 938 0570 |
| Fax: | 206 938 1307 |
| Website: | www.Traders.com |
| E-mail address: | DPenn@traders.com |
Traders' Resource Links | |
| Charting the Stock Market: The Wyckoff Method -- Books | |
| Working-Money.com -- Online Trading Services | |
| Traders.com Advantage -- Online Trading Services | |
| Technical Analysis of Stocks & Commodities -- Publications and Newsletters | |
| Working Money, at Working-Money.com -- Publications and Newsletters | |
| Traders.com Advantage -- Publications and Newsletters | |
| Professional Traders Starter Kit -- Software | |
Click here for more information about our publications!
Comments
Date: 10/08/01Rank: 5Comment:

Request Information From Our Sponsors
- VectorVest, Inc.
- Executive Premier Workshop
- One-Day Options Course
- OptionsPro
- Retirement Income Workshop
- Sure-Fire Trading Systems (VectorVest, Inc.)
- Trading as a Business Workshop
- VectorVest 7 EOD
- VectorVest 7 RealTime/IntraDay
- VectorVest AutoTester
- VectorVest Educational Services
- VectorVest OnLine
- VectorVest Options Analyzer
- VectorVest ProGraphics v6.0
- VectorVest ProTrader 7
- VectorVest RealTime Derby Tool
- VectorVest Simulator
- VectorVest Variator
- VectorVest Watchdog
- StockCharts.com, Inc.
- Candle Patterns
- Candlestick Charting Explained
- Intermarket Technical Analysis
- John Murphy on Chart Analysis
- John Murphy's Chart Pattern Recognition
- John Murphy's Market Message
- MurphyExplainsMarketAnalysis-Intermarket Analysis
- MurphyExplainsMarketAnalysis-Visual Analysis
- StockCharts.com
- Technical Analysis of the Financial Markets
- The Visual Investor
