HOT TOPICS LIST
- MACD
- Fibonacci
- RSI
- Gann
- ADXR
- Stochastics
- Volume
- Triangles
- Futures
- Cycles
- Volatility
- ZIGZAG
- MESA
- Retracement
- Aroon
INDICATORS LIST
LIST OF TOPICS
PRINT THIS ARTICLE
by Ron Walker
The QQQQ has formed two bearish patterns during its recent runup. But even though bearish forces are at work, how far could prices drop? An ascending broadening wedge pattern might hold the answer and reveal where the correction might be contained.
Position: N/A
Ron Walker
Ron Walker is an active trader and technical analyst. He operates an educational website dedicated to the study of Technical Analysis. The website offers free market analysis with daily video presentations and written commentaries. Ron is a video pioneer, being one of the first to utilize the internet producing Technical Analysis videos. His website is thechartpatterntrader.com
PRINT THIS ARTICLE
WEDGE FORMATIONS
QQQQ's Ascending Broadening Wedge
08/18/09 11:19:48 AMby Ron Walker
The QQQQ has formed two bearish patterns during its recent runup. But even though bearish forces are at work, how far could prices drop? An ascending broadening wedge pattern might hold the answer and reveal where the correction might be contained.
Position: N/A
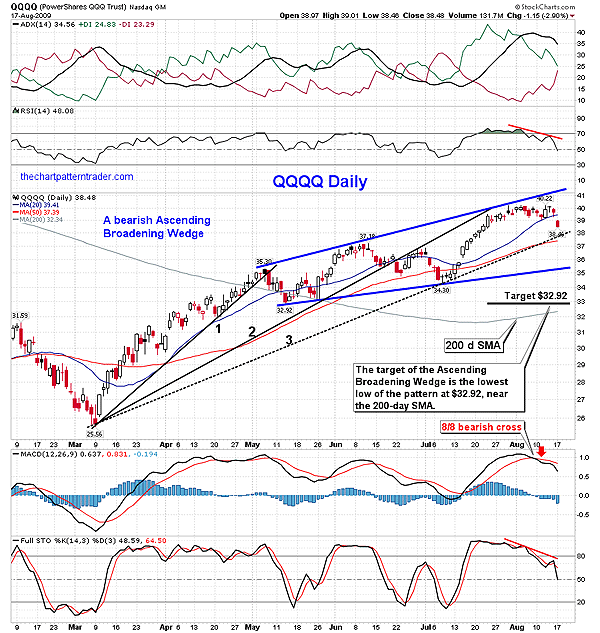
| After the daily chart of the PowerShares QQQ Trust (QQQQ) peaked in May, prices began to trade within the boundaries of two trends that sloped higher and that broadened out over the next several months (Figure 1). Prices fluctuated between these two rising trendlines; the grade of the lower boundary has been gradually sloping higher, while the upper boundary has been rising at a much steeper and elevated angle of ascent. These trendlines are not parallel like a rising price channel, but they broaden similarly to a traditional broadening formation. However, unlike a broadening formation, which makes lower lows, this pattern continues to produce higher lows, which gives it a wedge shape. It looks like a backward falling wedge pattern. |

|
| FIGURE 1: QQQQ, DAILY. The target of the ascending broadening wedge (trendlines marked in blue) measures to the lowest point in the pattern at $32.92. Meanwhile, the oscillators are unwinding. |
| Graphic provided by: StockCharts.com. |
| |
| More often than not, this pattern has bearish ramifications and could lead the march to a broad-based stock market retreat. Trader and author Thomas Bulkowski notes the bearish overtones of this pattern in his Encyclopedia Of Chart Patterns that "the breakout direction is downward the vast majority of times, but an upward breakout is not unheard of." The measurement of this pattern is calculated differently from the usual modus operandi that accompanies technical analysis, of taking the difference of the length of the pattern. The target of an ascending broadening wedge is simply the lowest low in the pattern. In this case, that would be the May low at $32.92. That target is just above the 200-day SMA (Figure 1). |
| In Figure 1, a powerful rally in July carried the Qs right up to rising resistance for a third touch of the upper trendline, which was soon met with a test back to the 20-day simple moving average (SMA). Remarkably, from the July intraday low $34.30 to the recent intraday peak of $40.22, the Qs have swung higher by 17.25%. The pendulum may have swung too far in one direction and could soon swing the other way. |
| A broad spectrum of indicators on the daily chart underscore the bearish nature of this pattern. The relative strength index (RSI) (14) has put in successive lower peaks, while prices continue to make equal peaks near the $40.20 area, resulting in a sharp reversal. The average directional movement index (ADX) (14) has peaked and is now sloping down, weakening the spread of the directional indicators (+DI and -DI) as they converged closer together. The moving average convergence/divergence (MACD) (12, 26, 9) got a bearish crossover on August 8, but remains above its zero line. Bullish momentum has run out on the stochastic (14, 3, 3), which has hooked lower after a bullish cross attempt failed to regain traction. The stochastic has moved below its median line at 50. There are a lot of insurmountable obstacles that lay ahead of the QQQQ that as a serious analyst I cannot ignore. All this information keeps drawing me to one conclusion: this tech-heavy fund is about to be whacked upside the head. |

|
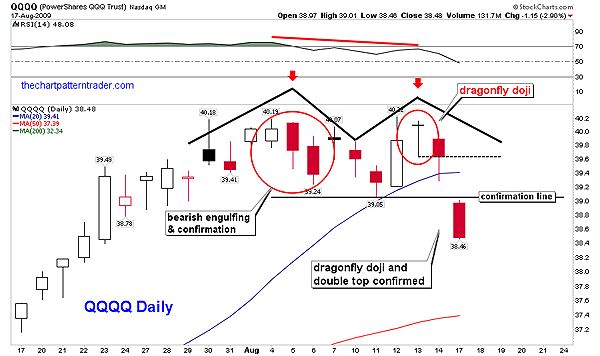
| FIGURE 2: QQQQ, DAILY. The day after the dragonfly doji appeared, QQQQ closed one penny below the doji's intraday low of $39.64. That wasn't a decisive penetration, and therefore, the reversal candle pattern remained unconfirmed until the next session. There, the Qs also broke below the last minor low, confirming a double-top pattern and fell below the 20-day SMA. |
| Graphic provided by: StockCharts.com. |
| |
| On August 13, a dragonfly doji candlestick appeared on the QQQQ daily chart (Figure 2). This pattern occurs when prices open and the close at the high of the day, and it is usually associated with turning points. The next session produced a reversal, but prices only closed one cent below the $39.64 low of the doji, failing to confirm the pattern. In the following session, the pattern received confirmation plunging below the doji, while simultaneously dropping below the 20-day SMA. This caused further technical damage, because from late July to mid-August, a bearish double-top pattern set up during the final runup of the ascending broadening wedge (Figure 2). As prices collapsed, it not only confirmed the dragonfly doji, but the double top as well. The confirmation line was at $39.05, the momentum low that separated the two distinct peaks. The pattern measures $1.17 with a target of 37.88, which is very close to the current rising trendline (seen in Figure 1) and the 50-day SMA. This is the third rising trendline since the March lows. If this trendline is violated, the price target of the ascending broadening wedge will likely play out, ultimately testing the 200-day SMA. |
Ron Walker is an active trader and technical analyst. He operates an educational website dedicated to the study of Technical Analysis. The website offers free market analysis with daily video presentations and written commentaries. Ron is a video pioneer, being one of the first to utilize the internet producing Technical Analysis videos. His website is thechartpatterntrader.com
| Website: | thechartpatterntrader.com |
| E-mail address: | thechartpatterntrader@gmail.com |
Click here for more information about our publications!
Comments
Date: 08/19/09Rank: 5Comment:

Request Information From Our Sponsors
- StockCharts.com, Inc.
- Candle Patterns
- Candlestick Charting Explained
- Intermarket Technical Analysis
- John Murphy on Chart Analysis
- John Murphy's Chart Pattern Recognition
- John Murphy's Market Message
- MurphyExplainsMarketAnalysis-Intermarket Analysis
- MurphyExplainsMarketAnalysis-Visual Analysis
- StockCharts.com
- Technical Analysis of the Financial Markets
- The Visual Investor
- VectorVest, Inc.
- Executive Premier Workshop
- One-Day Options Course
- OptionsPro
- Retirement Income Workshop
- Sure-Fire Trading Systems (VectorVest, Inc.)
- Trading as a Business Workshop
- VectorVest 7 EOD
- VectorVest 7 RealTime/IntraDay
- VectorVest AutoTester
- VectorVest Educational Services
- VectorVest OnLine
- VectorVest Options Analyzer
- VectorVest ProGraphics v6.0
- VectorVest ProTrader 7
- VectorVest RealTime Derby Tool
- VectorVest Simulator
- VectorVest Variator
- VectorVest Watchdog
