HOT TOPICS LIST
- MACD
- Fibonacci
- RSI
- Gann
- ADXR
- Stochastics
- Volume
- Triangles
- Futures
- Cycles
- Volatility
- ZIGZAG
- MESA
- Retracement
- Aroon
INDICATORS LIST
LIST OF TOPICS
PRINT THIS ARTICLE
by Donald W. Pendergast, Jr.
Even though the broad markets are still enmeshed in a major bull rally, it may still pay to dig through the relative strength rankings to seek out those lagging industry groups that may be poised to be tomorrow's leaders.
Position: Accumulate
Donald W. Pendergast, Jr.
Donald W. Pendergast is a financial markets consultant who offers specialized services to stock brokers and high net worth individuals who seek a better bottom line for their portfolios.
PRINT THIS ARTICLE
REL. STR COMPARATIVE
Sifting The Ashes For Tomorrow's Leaders With DBA
08/14/09 09:32:58 AMby Donald W. Pendergast, Jr.
Even though the broad markets are still enmeshed in a major bull rally, it may still pay to dig through the relative strength rankings to seek out those lagging industry groups that may be poised to be tomorrow's leaders.
Position: Accumulate
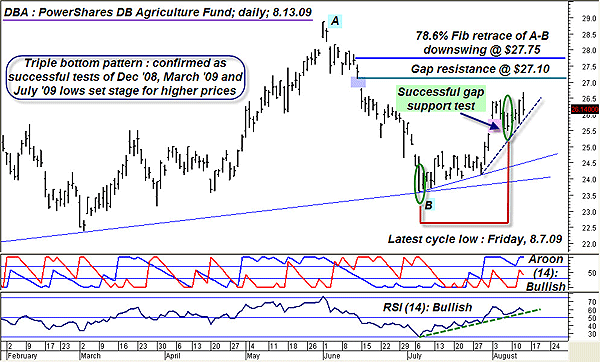
| Invesco's PowerShares DB Agriculture Fund (DBA) offers retail equity investors and traders a convenient way to get involved with trading the agricultural commodities markets. The fund buys and sells futures contracts on the following four commodities: sugar, soybeans, corn, and wheat. Figure 1 is a brief look at DBA's daily graph. |

|
| FIGURE 1: DBA, DAILY. Prices have responded favorably in the wake of a major triple-bottom pattern; the current daily price cycle appears likely to carry DBA up to test initial resistance near $27.10. |
| Graphic provided by: MetaStock. |
| |
| DBA was well-received by an investing public hungry for ever-greater commodity exposure; they promptly bought enough of it for long enough to drive the price of DBA nearly parabolic by early 2008, barely a year after its initial offering. Following the initial burst of enthusiasm came the gradual unwinding of the global commodity bull market, one that took down nearly every class of commodity from metals to energy to softs to grains. DBA was also taken lower in this global rout, losing about half of its value by December 2008, which is when it made a major, enduring low at $21.52. Unlike the major stock indexes, which put in a lower low in March 2009, DBA actually made a higher low before running up another 30% by early June 2009. DBA sold off hard for another five weeks, but lo and behold, in early July it actually made another higher low -- the final foundation piece for a triple-bottom pattern, one of the more reliable of all major chart patterns. The price action in the wake of the confirmed triple bottom pattern has been very impressive, too; note the large gap in early August, one that has been successfully tested. Prices tested the lower boundary of the gap and then reversed higher, intimating the likelihood of further follow-through. This also appears to be confirmed by the bullish stance of the Aroon (14) trend intensity indicator, which is now in major bullish mode, as is the strong trend of the relative strength index (RSI)(14) at the bottom of the chart. The RSI jumped substantially above 60 on the retracement up from the triple bottom, and it is still well above the 60 level at this time. Also of note is that DBA also appears to have put in a confirmed daily cycle low on Friday, August 7, 2009, which is yet another factor that may indicate further upside for this unique commodity exchange traded fund (ETF). DBA will face some significant overhead resistance near $27.10 and then $27.75, but this ETF may still have some room to run before turbulence should be expected. See Figure 2. |

|
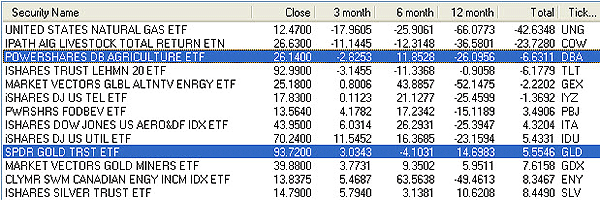
| FIGURE 2: A TALE OF TWO ETFS. August 13, 2009: DBA has gained significant ground on its six-month ranking, even as GLD plummeted from position #14 to #40 in just nine trading days. |
| Graphic provided by: MetaStock. |
| Graphic provided by: Metastock's Explorer. |
| |
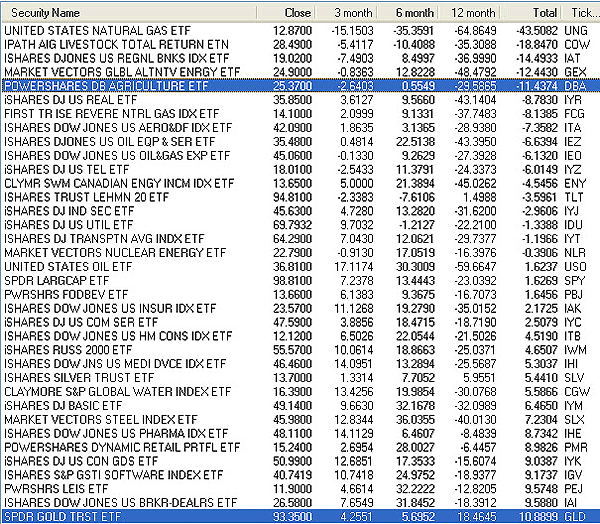
| Earlier, I mentioned that DBA was still relatively low in the ranking hierarchy of the 49 ETFs that I regularly track; that's true, as the above graphic shows, but take a look now at the same list of ETFs from two weeks ago to learn why DBA may be ready to move much higher in the ranking hierarchy in the weeks to come. Even though DBA's nominal score has only improved a bit (from -11.44 up to -6.63) and even though it has actually fallen from #45 to #47 in the numerical rankings, it's worth noting the rate of change in another commodity-linked ETF, GLD (Figure 3). GLD's score was 10.89 in recent weeks, but it now has dropped down to 5.55; even more telling is the rapid plunge in GLD's numerical ranking, falling all the way from #14 down to #40 in just nine trading sessions! So, while at first glance it appears that DBA is treading water, the reality is that compared to GLD, DBA is gaining ground against GLD on a relative strength basis. If you spend a few hours a week looking at the ups and downs of the various scores and rankings on your relative strength explorations, you can start to develop an understanding of the relationships between the various commodities and industry groups that simply isn't able to be discerned by looking at price charts alone. |

|
| FIGURE 3: RELATIVE STRENGTH RANKS. July 31, 2009: Relative strength rankings can change in the blink of an eye. GLD occupied position #14 of 49 only nine trading days ago. Clearly, more commodity money is being poured into agricultural futures contracts than into the gold market. |
| Graphic provided by: MetaStock. |
| Graphic provided by: Metastock's Explorer. |
| |
| Bottom line: DBA may be poised to gain more ground in the weeks ahead. Consider accumulating DBA on proportional daily pullbacks, particularly if DBA's weekly Aroon (14) and RSI (14) indicators also move into confirmed bullish mode. |
Donald W. Pendergast is a financial markets consultant who offers specialized services to stock brokers and high net worth individuals who seek a better bottom line for their portfolios.
| Title: | Writer, market consultant |
| Company: | Linear Trading Systems LLC |
| Jacksonville, FL 32217 | |
| Phone # for sales: | 904-239-9564 |
| E-mail address: | lineartradingsys@gmail.com |
Traders' Resource Links | |
| Linear Trading Systems LLC has not added any product or service information to TRADERS' RESOURCE. | |
Click here for more information about our publications!
Comments
Date: 08/16/09Rank: 3Comment:
Date: 08/18/09Rank: 5Comment:

Request Information From Our Sponsors
- StockCharts.com, Inc.
- Candle Patterns
- Candlestick Charting Explained
- Intermarket Technical Analysis
- John Murphy on Chart Analysis
- John Murphy's Chart Pattern Recognition
- John Murphy's Market Message
- MurphyExplainsMarketAnalysis-Intermarket Analysis
- MurphyExplainsMarketAnalysis-Visual Analysis
- StockCharts.com
- Technical Analysis of the Financial Markets
- The Visual Investor
- VectorVest, Inc.
- Executive Premier Workshop
- One-Day Options Course
- OptionsPro
- Retirement Income Workshop
- Sure-Fire Trading Systems (VectorVest, Inc.)
- Trading as a Business Workshop
- VectorVest 7 EOD
- VectorVest 7 RealTime/IntraDay
- VectorVest AutoTester
- VectorVest Educational Services
- VectorVest OnLine
- VectorVest Options Analyzer
- VectorVest ProGraphics v6.0
- VectorVest ProTrader 7
- VectorVest RealTime Derby Tool
- VectorVest Simulator
- VectorVest Variator
- VectorVest Watchdog
