HOT TOPICS LIST
- MACD
- Fibonacci
- RSI
- Gann
- ADXR
- Stochastics
- Volume
- Triangles
- Futures
- Cycles
- Volatility
- ZIGZAG
- MESA
- Retracement
- Aroon
INDICATORS LIST
LIST OF TOPICS
PRINT THIS ARTICLE
by Koos van der Merwe
When the technology sector crashed in 2000, the NASDAQ index crashed heavily along with it. But in the recovery phase, the Elliott wave B-wave , the index rose only as far as the 38.2% Fibonacci correction.
Position: Sell
Koos van der Merwe
Has been a technical analyst since 1969, and has worked as a futures and options trader with First Financial Futures in Johannesburg, South Africa.
PRINT THIS ARTICLE
ELLIOTT WAVE
What About The NASDAQ?
08/12/09 10:17:20 AMby Koos van der Merwe
When the technology sector crashed in 2000, the NASDAQ index crashed heavily along with it. But in the recovery phase, the Elliott wave B-wave , the index rose only as far as the 38.2% Fibonacci correction.
Position: Sell
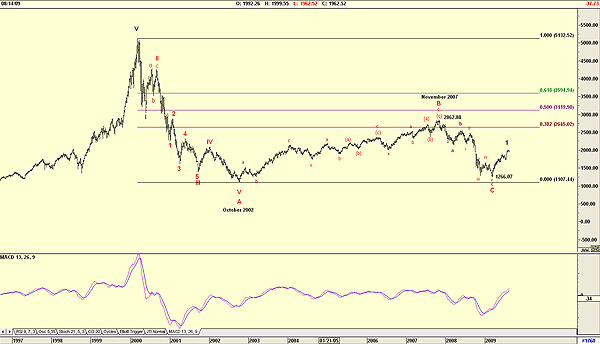
| With the bursting of the technology bubble, the NASDAQ index fell from the fifth-wave high of 5132.52 to a low of 1107.44, a fall of 78%. This collapse was horrific, and many small startup companies that climbed on the back of the floating bubble vanished. |

|
| FIGURE 1: NASDAQ, WEEKLY. This chart suggests a wave count. |
| Graphic provided by: AdvancedGET. |
| |
| Since that date, NASDAQ has recovered, but cautiously, as though testing each step before putting its full weight on it. Figure 1, a weekly chart of the NASDAQ, shows how the B-wave rose gradually in an abcxabc wave count, and gradually, from the low of 1107.44 to the high of 2862.88 by November 2007. This high was slightly above the 38.2% Fibonacci level, showing how cautiously the index corrected. (By comparison, the Standard & Poor's 500 corrected over 100% in its B-wave.) The index then fell in a C-wave to 1266.07, not the 1107.44 of the low of wave A. This does suggest a C-wave failure, which means that in the years ahead, the NASDAQ will rise to exorbitant levels. The chart does suggest that the index has moved into a wave I upward, but the moving average convergence/divergence (MACD) indicator suggests that further strength lies ahead, and that the wave is not complete. For this reason, I turn to Figure 2. |

|
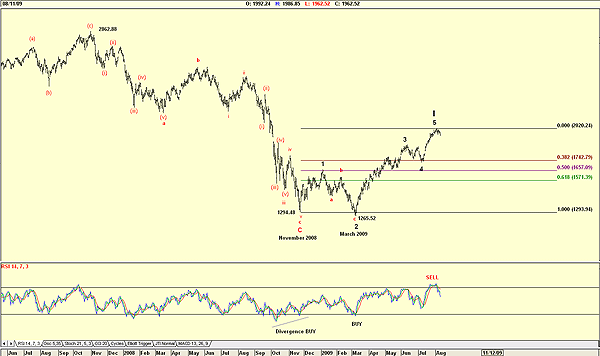
| FIGURE 2: NASDAQ, DAILY. This chart suggests a different wave count than the weekly chart. |
| Graphic provided by: AdvancedGET. |
| |
| Figure 2, a daily chart, suggests a change in the Elliott wave count. The count suggests that the Index bottomed in a C-wave in November 2008 at 1294.48, and that the low of 1265.52, although lower than the low of the C-wave, is the bottom of a wave 2 of a wave I in the new bull market. If this is so, we can then expect a correction to one of the Fibonacci correction levels shown on the chart, the most likely target being 1742.79, the 38.2% level that acted as support for the wave 4 of wave I correction. The relative strength index (RSI) supports this count, and has given a sell signal, suggesting that a correction is on the cards. The NASDAQ is due for a correction, which should see it test the 1742 level, a level that previously gave support to a fourth-wave correction of wave I. |
Has been a technical analyst since 1969, and has worked as a futures and options trader with First Financial Futures in Johannesburg, South Africa.
| Address: | 3256 West 24th Ave |
| Vancouver, BC | |
| Phone # for sales: | 6042634214 |
| E-mail address: | petroosp@gmail.com |
Click here for more information about our publications!
Comments
Date: 08/12/09Rank: 3Comment:
Date: 09/12/09Rank: 1Comment: This is not Elliott Wave as your wave two being lower than your wave one,breaks the rules of Elliott Wave Principle. The count suggests that the Index bottomed in a C-wave in November 2008 at 1294.48, and that the low of 1265.52, although lower than the low of the C-wave, is the bottom of a wave 2 of a wave I in the new bull market.
Date: 09/12/09Rank: 1Comment: This is not Elliott Wave as your wave two being lower than your wave one,breaks the rules of Elliott Wave Principle. The count suggests that the Index bottomed in a C-wave in November 2008 at 1294.48, and that the low of 1265.52, although lower than the low of the C-wave, is the bottom of a wave 2 of a wave I in the new bull market.

|

Request Information From Our Sponsors
- StockCharts.com, Inc.
- Candle Patterns
- Candlestick Charting Explained
- Intermarket Technical Analysis
- John Murphy on Chart Analysis
- John Murphy's Chart Pattern Recognition
- John Murphy's Market Message
- MurphyExplainsMarketAnalysis-Intermarket Analysis
- MurphyExplainsMarketAnalysis-Visual Analysis
- StockCharts.com
- Technical Analysis of the Financial Markets
- The Visual Investor
- VectorVest, Inc.
- Executive Premier Workshop
- One-Day Options Course
- OptionsPro
- Retirement Income Workshop
- Sure-Fire Trading Systems (VectorVest, Inc.)
- Trading as a Business Workshop
- VectorVest 7 EOD
- VectorVest 7 RealTime/IntraDay
- VectorVest AutoTester
- VectorVest Educational Services
- VectorVest OnLine
- VectorVest Options Analyzer
- VectorVest ProGraphics v6.0
- VectorVest ProTrader 7
- VectorVest RealTime Derby Tool
- VectorVest Simulator
- VectorVest Variator
- VectorVest Watchdog
