HOT TOPICS LIST
- MACD
- Fibonacci
- RSI
- Gann
- ADXR
- Stochastics
- Volume
- Triangles
- Futures
- Cycles
- Volatility
- ZIGZAG
- MESA
- Retracement
- Aroon
INDICATORS LIST
LIST OF TOPICS
PRINT THIS ARTICLE
by Chaitali Mohile
After struggling for almost nine years, Ford has surged into a bullish region.
Position: Buy
Chaitali Mohile
Active trader in the Indian stock markets since 2003 and a full-time writer. Trading is largely based upon technical analysis.
PRINT THIS ARTICLE
CHART ANALYSIS
Ford Motor In High Spirits
08/12/09 10:12:07 AMby Chaitali Mohile
After struggling for almost nine years, Ford has surged into a bullish region.
Position: Buy
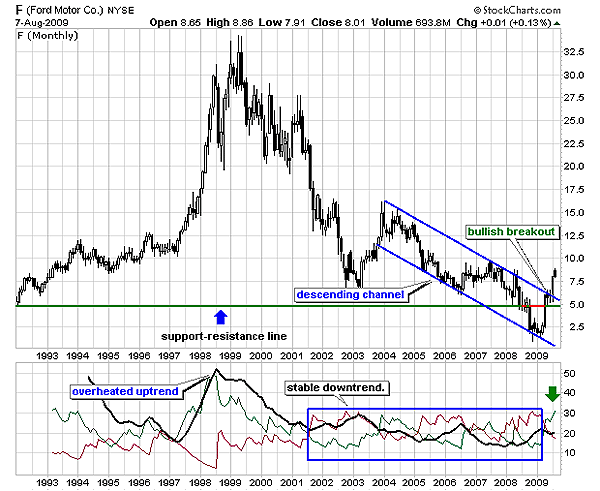
| According to the monthly chart in Figure 1, Ford Motor Co. (F) began its bullish journey in 1993 from $5 and made an all-time high in 1999-2000 at $32.50. Thereafter, the stock lost its entire gains of the past few years. The corrective rally dragged F back to its original level at $5, but the bloodshed continued. The stock formed lower lows and lower highs, forming a descending channel in Figure 1. The average directional movement index (ADX) (14) was highly overheated in 1999-2000, when the stock was at its peak. The overheated uptrend thus reversed, generating a bearish rally. Since then, the downtrend turned stronger. The descending channel's bullish breakout gave birth to a fresh uptrend after a period of nine years (see the green arrow). We can see that the channel broke at $5 and soon reached the $7.50 level. This robust breakout cannot be ignored. |

|
| FIGURE 1: F, MONTHLY. The stock drifted even below the historical low. The descending channel broke upward, generating fresh demand in the market. The fresh uptrend was developed after a long period. |
| Graphic provided by: StockCharts.com. |
| |
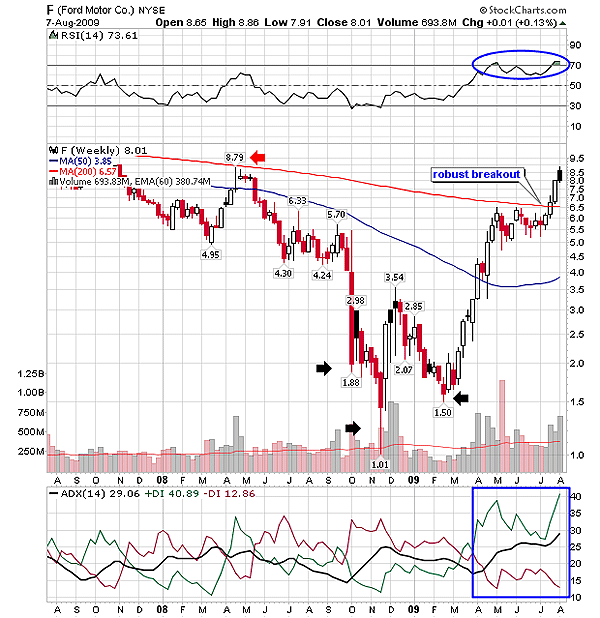
| On the weekly chart in Figure 2, the stock has surged above the 200-day moving average (MA) resistance. Earlier, F failed to breach the same resistance in 2008 due to the weak bullish trend. The relative strength index (RSI) (14) that was unable to move above 60 levels plunged to an oversold zone. But the current situation is different; the RSI (14) slipped into an overbought area during the 200-day MA breakout. The momentum indicator is likely to move straight in the bullish zone. The ADX (14) is suggesting a developing uptrend above the 25 levels. Thus, fresh buying opportunities have been opened for long-term traders. |

|
| FIGURE 2: F, WEEKLY. The black arrows show the two lower lows and a higher low. |
| Graphic provided by: StockCharts.com. |
| |
| Before the actual breakout, F consolidated under the 200-day MA resistance and formed a short-term bullish continuation pattern. The consolidation, after an exclusive advance rally, constructed a bullish flag & pennant pattern in Figure 2. The pattern has already broken in the bullish direction and hit a 52-week high as well, and thus the breakout is highly reliable. The minimum estimated level for the breakout rally would be 6.50 - 1.50 = 5 + 6.50 = 11.50. The long positions could be held till it hits the target of $11.50. |

|
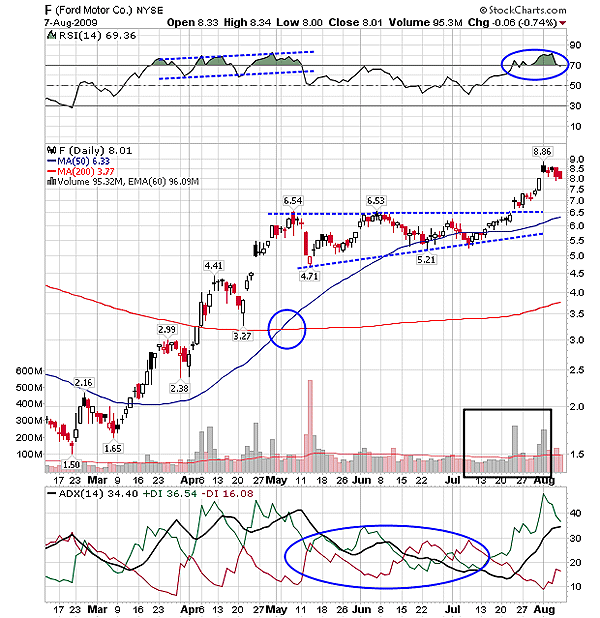
| FIGURE 3: F, DAILY. The bullish flag & pennant pattern breakout. |
| Graphic provided by: StockCharts.com. |
| |
| Similarly, on the daily time frame in Figure 3 the flag & pennant formation is visible, which has already broken upward. The bullish moving average crossover, the marked circle, strengthens the prebreakout rally. The crossover gathered the bullish sentiments required for the pattern breakout. The RSI (14) sustained above the 50 level, indicating bullish force, and the ADX (14) that turned weak during the consolidation phase ultimately developed an uptrend. Currently, F is marginally moving sideways after the breakout, but the bullishness of the rally would be sustained. |
| Thus, the trading setup in F for long-term as well as short-term investors is most suitable and reliable. |
Active trader in the Indian stock markets since 2003 and a full-time writer. Trading is largely based upon technical analysis.
| Company: | Independent |
| Address: | C1/3 Parth Indraprasth Towers. Vastrapur |
| Ahmedabad, Guj 380015 | |
| E-mail address: | chaitalimohile@yahoo.co.in |
Traders' Resource Links | |
| Independent has not added any product or service information to TRADERS' RESOURCE. | |
Click here for more information about our publications!
Comments
Date: 08/12/09Rank: 3Comment:

Request Information From Our Sponsors
- StockCharts.com, Inc.
- Candle Patterns
- Candlestick Charting Explained
- Intermarket Technical Analysis
- John Murphy on Chart Analysis
- John Murphy's Chart Pattern Recognition
- John Murphy's Market Message
- MurphyExplainsMarketAnalysis-Intermarket Analysis
- MurphyExplainsMarketAnalysis-Visual Analysis
- StockCharts.com
- Technical Analysis of the Financial Markets
- The Visual Investor
- VectorVest, Inc.
- Executive Premier Workshop
- One-Day Options Course
- OptionsPro
- Retirement Income Workshop
- Sure-Fire Trading Systems (VectorVest, Inc.)
- Trading as a Business Workshop
- VectorVest 7 EOD
- VectorVest 7 RealTime/IntraDay
- VectorVest AutoTester
- VectorVest Educational Services
- VectorVest OnLine
- VectorVest Options Analyzer
- VectorVest ProGraphics v6.0
- VectorVest ProTrader 7
- VectorVest RealTime Derby Tool
- VectorVest Simulator
- VectorVest Variator
- VectorVest Watchdog
