HOT TOPICS LIST
- MACD
- Fibonacci
- RSI
- Gann
- ADXR
- Stochastics
- Volume
- Triangles
- Futures
- Cycles
- Volatility
- ZIGZAG
- MESA
- Retracement
- Aroon
INDICATORS LIST
LIST OF TOPICS
PRINT THIS ARTICLE
by David Penn
With the 10-year Treasury headed toward historic resistance, is the bond party over?
Position: N/A
David Penn
Technical Writer for Technical Analysis of STOCKS & COMMODITIES magazine, Working-Money.com, and Traders.com Advantage.
PRINT THIS ARTICLE
BOND & INTEREST RATE
Bad News for Bonds?
10/04/01 03:15:52 PMby David Penn
With the 10-year Treasury headed toward historic resistance, is the bond party over?
Position: N/A
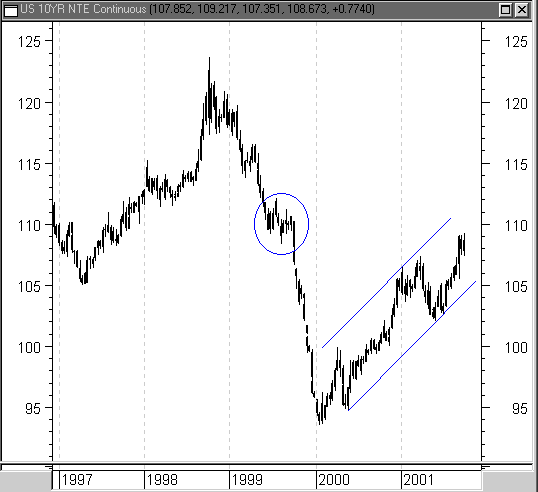
| The 10-year Treasury has been in a bull market since the beginning of 2000, after a precipitous decline from its spring 1998 high of 122. This bull market in bonds has coincided, not coincidentally, with a very difficult environment for stocks--and that only where stocks were not in an outright bear market. I have suggested elsewhere (see "Bonds and Stock Market Bottoms", August 31, 2001, Traders.com) that bond prices and stock prices tend to trend in the same direction and that when they do not, a major break is likely. With bonds moving up and stocks still moving down, trying to figure out what a break may look like becomes increasingly important. |
| On its way from 122 in the spring of 1998 to about 94 in the winter of 1999, the 10-year Treasury consolidated for a period of about six months between the spring and fall of 1999 in the 111 to 108 area. The break from this consolidation was severe: the 10-year note lost 13% in about three months before finally reaching a bottom in January 2000 and testing that bottom successfully in March of that year. And save for some churning at the end of 2000, the 10-year note continued its bullish ways well into 2001. |

|
| The 10-year Treasury moves toward the top of a trend channel at the same time as it approaches historic resistance at 110. |
| Graphic provided by: MetaStock. |
| |
| Unfortunately, the consolidation area from 1999 now looms as historical resistance as the 10-year Treasury moves above 108 and struggles to get north of 109. It is worth noting that the ride from the 2000 lows encountered virtually no resistance at all, due in large part to the speed with which the 10-year note collapsed in 1999. And while the resistance in the 111 to 108 area is not especially recent nor especially massive in size, the fact that it represents the most significant area of potential accumulation/distribution in the 10-year Treasury in the past four years, makes the area very much worth watching. |
| There is another reason to pay attention to the 10-year Treasury, and to bonds in general. Because stocks and bonds tend to move in the same direction, divergences--when they occur--become very important. When bonds decline, for example, that movement often presages declines in the stock market. John Murphy makes this point very soundly in his INTERMARKET TECHNICAL ANALYSIS using the example of the October 1987 market crash, and it is worthwhile to note the bond market collapse (as represented by the 10-year Treasury) from mid-1998 to the end of 1999 as a possible precursor to the stock market collapse that began in 2000 and continues into late 2001. |
| On a more speculative note, the 10-year Treasury's weekly chart suggests that the bond may be making an intermediate head and shoulders top, with a potential left shoulder already fully formed (November 2000 to April 2001) and the left side of the head--again, potentially--currently under development. Should the 10-year Treasury stall out in the 111 to 108 area and decline, support at 102 would help the bond complete the head of that intermediate, bearish pattern. A subsequent failed rally, one that could not lift the bond above the height of the November 2000 / April 2001 rally (much less than July / August 2001 rally), would be all that's required to complete the intermediate head and shoulders and, quite possibly send the 10-year careening toward a test of its 2000 lows. |
Technical Writer for Technical Analysis of STOCKS & COMMODITIES magazine, Working-Money.com, and Traders.com Advantage.
| Title: | Technical Writer |
| Company: | Technical Analysis, Inc. |
| Address: | 4757 California Avenue SW |
| Seattle, WA 98116 | |
| Phone # for sales: | 206 938 0570 |
| Fax: | 206 938 1307 |
| Website: | www.Traders.com |
| E-mail address: | DPenn@traders.com |
Traders' Resource Links | |
| Charting the Stock Market: The Wyckoff Method -- Books | |
| Working-Money.com -- Online Trading Services | |
| Traders.com Advantage -- Online Trading Services | |
| Technical Analysis of Stocks & Commodities -- Publications and Newsletters | |
| Working Money, at Working-Money.com -- Publications and Newsletters | |
| Traders.com Advantage -- Publications and Newsletters | |
| Professional Traders Starter Kit -- Software | |
Click here for more information about our publications!
Comments

Request Information From Our Sponsors
- StockCharts.com, Inc.
- Candle Patterns
- Candlestick Charting Explained
- Intermarket Technical Analysis
- John Murphy on Chart Analysis
- John Murphy's Chart Pattern Recognition
- John Murphy's Market Message
- MurphyExplainsMarketAnalysis-Intermarket Analysis
- MurphyExplainsMarketAnalysis-Visual Analysis
- StockCharts.com
- Technical Analysis of the Financial Markets
- The Visual Investor
- VectorVest, Inc.
- Executive Premier Workshop
- One-Day Options Course
- OptionsPro
- Retirement Income Workshop
- Sure-Fire Trading Systems (VectorVest, Inc.)
- Trading as a Business Workshop
- VectorVest 7 EOD
- VectorVest 7 RealTime/IntraDay
- VectorVest AutoTester
- VectorVest Educational Services
- VectorVest OnLine
- VectorVest Options Analyzer
- VectorVest ProGraphics v6.0
- VectorVest ProTrader 7
- VectorVest RealTime Derby Tool
- VectorVest Simulator
- VectorVest Variator
- VectorVest Watchdog
