HOT TOPICS LIST
- MACD
- Fibonacci
- RSI
- Gann
- ADXR
- Stochastics
- Volume
- Triangles
- Futures
- Cycles
- Volatility
- ZIGZAG
- MESA
- Retracement
- Aroon
INDICATORS LIST
LIST OF TOPICS
PRINT THIS ARTICLE
by Austin Passamonte
Here's a long-term chart view of the 10-year note futures.
Position: N/A
Austin Passamonte
Austin is a private trader who trades emini stock index futures intraday. He currently trades various futures markets from home in addition to managing a trader's educational forum
PRINT THIS ARTICLE
TECHNICAL ANALYSIS
Traders, Take (10-Year) Note
08/14/09 09:22:45 AMby Austin Passamonte
Here's a long-term chart view of the 10-year note futures.
Position: N/A
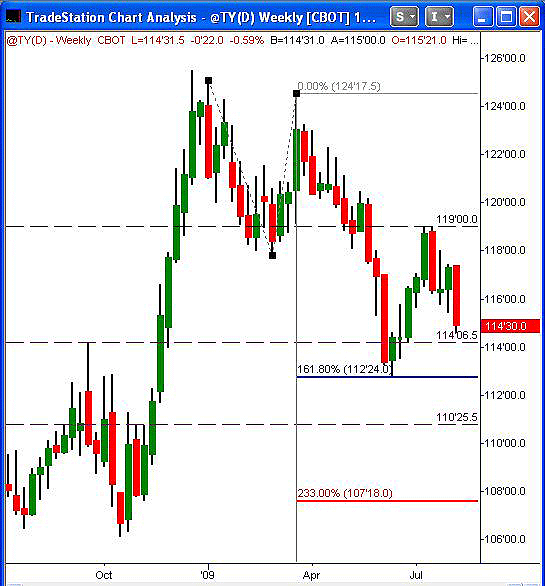
| US debt instruments have traversed a tumultuous trail from last year's stock market meltdown through this year's current meltup. Bond markets usually lead equity markets and usually forecast pending price direction better than any other financial market. Taking notes of the 10-year note (TY) is a leading indicator for stocks in addition to being an excellent trading vehicle itself. |

|
| FIGURE 1: US 10-YEAR NOTE, WEEKLY |
| Graphic provided by: TradeStation. |
| |
| The weekly chart view of the TY contract (Figure 1) shows recent swing highs at the 119-60 level as critical support/resistance mesh for the past 10 months and counting. The 114-60 level barely below resting price action right now is a reactionary swing point dating back to September 2008 onward. Another test of that zone is imminent: 112'+ is a deeper mesh of price magnetism just below. |
| From the 112' zone, it's congestive all the way to 108'-107' swing lows from the double-bottom pattern last year. The 10-year note is almost exactly at a 50% retracement from the 106 to 126 overall range. If it fails to bounce and turn back toward the 119' layer, look for the 108' handle to be fulfilled by or before year's end. |
Austin is a private trader who trades emini stock index futures intraday. He currently trades various futures markets from home in addition to managing a trader's educational forum
| Title: | Individual Trader |
| Company: | CoiledMarkets.com |
| Address: | PO Box 633 |
| Naples, NY 14512 | |
| Website: | coiledmarkets.com/blog |
| E-mail address: | austinp44@yahoo.com |
Traders' Resource Links | |
| CoiledMarkets.com has not added any product or service information to TRADERS' RESOURCE. | |
Click here for more information about our publications!
Comments
Date: 08/16/09Rank: 3Comment:

Request Information From Our Sponsors
- StockCharts.com, Inc.
- Candle Patterns
- Candlestick Charting Explained
- Intermarket Technical Analysis
- John Murphy on Chart Analysis
- John Murphy's Chart Pattern Recognition
- John Murphy's Market Message
- MurphyExplainsMarketAnalysis-Intermarket Analysis
- MurphyExplainsMarketAnalysis-Visual Analysis
- StockCharts.com
- Technical Analysis of the Financial Markets
- The Visual Investor
- VectorVest, Inc.
- Executive Premier Workshop
- One-Day Options Course
- OptionsPro
- Retirement Income Workshop
- Sure-Fire Trading Systems (VectorVest, Inc.)
- Trading as a Business Workshop
- VectorVest 7 EOD
- VectorVest 7 RealTime/IntraDay
- VectorVest AutoTester
- VectorVest Educational Services
- VectorVest OnLine
- VectorVest Options Analyzer
- VectorVest ProGraphics v6.0
- VectorVest ProTrader 7
- VectorVest RealTime Derby Tool
- VectorVest Simulator
- VectorVest Variator
- VectorVest Watchdog
