HOT TOPICS LIST
- MACD
- Fibonacci
- RSI
- Gann
- ADXR
- Stochastics
- Volume
- Triangles
- Futures
- Cycles
- Volatility
- ZIGZAG
- MESA
- Retracement
- Aroon
INDICATORS LIST
LIST OF TOPICS
PRINT THIS ARTICLE
by Austin Passamonte
Here's a long-term chart view of price measurement per the NASDAQ 100 index futures.
Position: N/A
Austin Passamonte
Austin is a private trader who trades emini stock index futures intraday. He currently trades various futures markets from home in addition to managing a trader's educational forum
PRINT THIS ARTICLE
TECHNICAL ANALYSIS
Hard Hat Zone
08/13/09 08:41:37 AMby Austin Passamonte
Here's a long-term chart view of price measurement per the NASDAQ 100 index futures.
Position: N/A
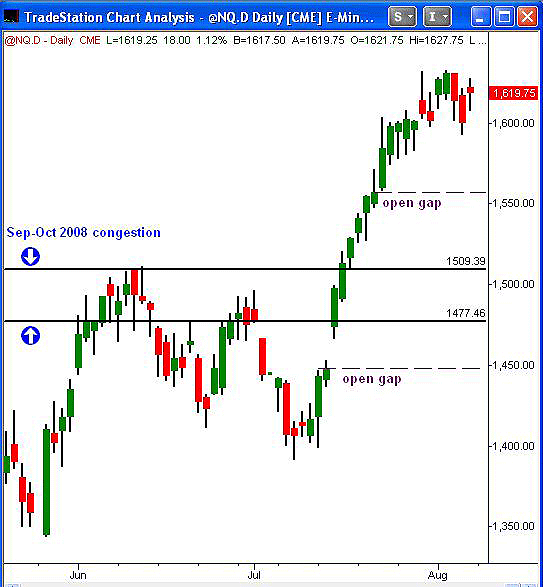
| The summer 2009 stock market rally has been led all the way by technology stocks. NASDAQ 100 is on an upward tear, with no visible end in sight. |

|
| FIGURE 1: NQ, DAILY |
| Graphic provided by: TradeStation. |
| |
| Below the current peak highs in NQ, we see an open gap from the July 22nd session close around the 1556 level (Figure 1). Slightly below, there is a congestion channel that began in the drop from September-October 2008 and contained price movement on the way back up in mid-2009. That channel will probably be retested sooner or later as confirmed solid support. |

|
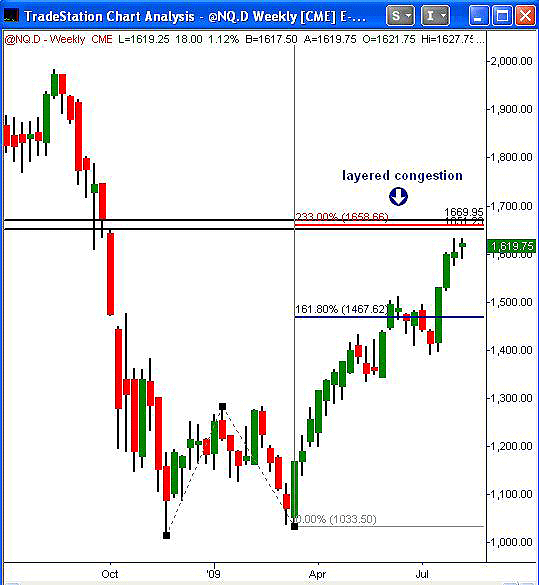
| FIGURE 2: NQ, WEEKLY |
| Graphic provided by: TradeStation. |
| |
| Looking at the wider view on the weekly NQ chart, where a jumbled layer of overhead congestion awaits an inevitable test of resistance (Figure 2). NQ 1650- 1670 is an open gap from last year and a Fibonacci projection of 233% from the 1-2-3 bottom formation is visible. |
| At the very least, we can expect NQ price action to pause or stall in this zone before the next resolution higher. It is entirely possible that will mark a swing-high top into a back and fill retracement to the price magnets depicted. There are no certainties in trading: just scenarios. Heavy congestion lies just above the resting NQ price action. A pivotal zone and key inflection area could determine the balance of 2009 and possibly beyond. |
Austin is a private trader who trades emini stock index futures intraday. He currently trades various futures markets from home in addition to managing a trader's educational forum
| Title: | Individual Trader |
| Company: | CoiledMarkets.com |
| Address: | PO Box 633 |
| Naples, NY 14512 | |
| Website: | coiledmarkets.com/blog |
| E-mail address: | austinp44@yahoo.com |
Traders' Resource Links | |
| CoiledMarkets.com has not added any product or service information to TRADERS' RESOURCE. | |
Click here for more information about our publications!
Comments
Date: 08/13/09Rank: 4Comment:

|

Request Information From Our Sponsors
- StockCharts.com, Inc.
- Candle Patterns
- Candlestick Charting Explained
- Intermarket Technical Analysis
- John Murphy on Chart Analysis
- John Murphy's Chart Pattern Recognition
- John Murphy's Market Message
- MurphyExplainsMarketAnalysis-Intermarket Analysis
- MurphyExplainsMarketAnalysis-Visual Analysis
- StockCharts.com
- Technical Analysis of the Financial Markets
- The Visual Investor
- VectorVest, Inc.
- Executive Premier Workshop
- One-Day Options Course
- OptionsPro
- Retirement Income Workshop
- Sure-Fire Trading Systems (VectorVest, Inc.)
- Trading as a Business Workshop
- VectorVest 7 EOD
- VectorVest 7 RealTime/IntraDay
- VectorVest AutoTester
- VectorVest Educational Services
- VectorVest OnLine
- VectorVest Options Analyzer
- VectorVest ProGraphics v6.0
- VectorVest ProTrader 7
- VectorVest RealTime Derby Tool
- VectorVest Simulator
- VectorVest Variator
- VectorVest Watchdog
