HOT TOPICS LIST
- MACD
- Fibonacci
- RSI
- Gann
- ADXR
- Stochastics
- Volume
- Triangles
- Futures
- Cycles
- Volatility
- ZIGZAG
- MESA
- Retracement
- Aroon
INDICATORS LIST
LIST OF TOPICS
PRINT THIS ARTICLE
by Austin Passamonte
Measuring price-action potential direction in the S&P 500 futures market.
Position: N/A
Austin Passamonte
Austin is a private trader who trades emini stock index futures intraday. He currently trades various futures markets from home in addition to managing a trader's educational forum
PRINT THIS ARTICLE
TECHNICAL ANALYSIS
Swiss Cheese Rally?
08/13/09 08:30:39 AMby Austin Passamonte
Measuring price-action potential direction in the S&P 500 futures market.
Position: N/A
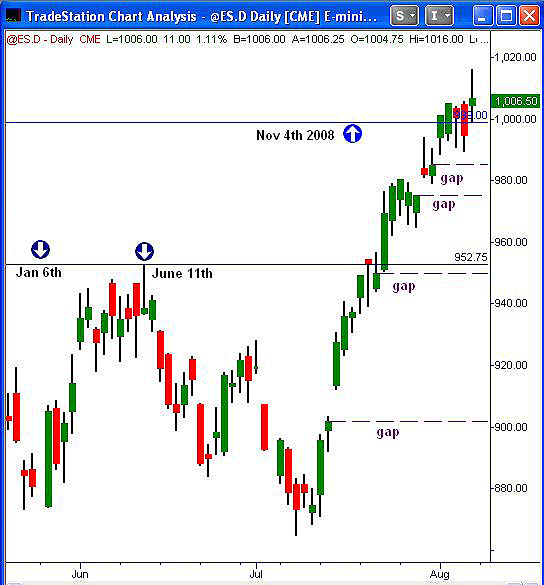
| The summer stock market rally of July-August 2009 (and counting) has reached new yearly highs. It accomplished this in dramatic fashion, rallying from the 870 levels to nearly 1020 peak highs in about 20 trading sessions. See Figure 1. |

|
| FIGURE 1: S&P 500 FUTURES, DAILY |
| Graphic provided by: TradeStation. |
| |
| Along the way, it has left behind no less than four remaining open gaps (purple dashed lines) in the process. Now it's not unusual for a strong market turn to spin away from an island reversal or similar open gap formation. But four open gaps in the span of one trading month? That leaves support below looking much like a block of premium Swiss cheese rather than blocks of concrete for foundation. |
| The November 4, 2008, highs near 1000 were also a pivotal price magnet through October last year as well. Prior resistance has currently turned to support, much like the triple-top high near 973 from January, June, and July 2009. Those two levels are highly probable to magnetize price on any subsequent pullback from (ultimate) peak highs through retracement back and fill. |

|
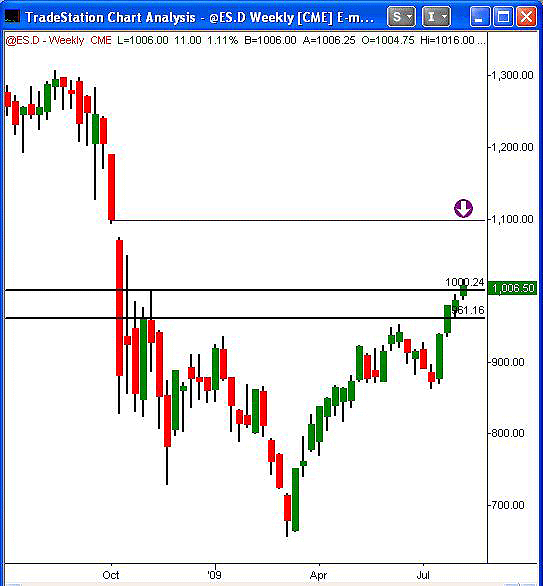
| FIGURE 2: S&P 500 FUTURES, WEEKLY |
| Graphic provided by: TradeStation. |
| |
| But before that happens, it is entirely possible for a continued light-volume push toward ES 1100 level where a big open gap remains since September-October 2008. The 960-1000 price channel is clearly visible on its weekly chart (Figure 2). Back down to the bottom of that measure would fill two open gaps and confirm prior resistance as solid support. A rapid push to the 1100 levels before that back and fill would leave this market grossly extended on spindly legs beneath. |
Austin is a private trader who trades emini stock index futures intraday. He currently trades various futures markets from home in addition to managing a trader's educational forum
| Title: | Individual Trader |
| Company: | CoiledMarkets.com |
| Address: | PO Box 633 |
| Naples, NY 14512 | |
| Website: | coiledmarkets.com/blog |
| E-mail address: | austinp44@yahoo.com |
Traders' Resource Links | |
| CoiledMarkets.com has not added any product or service information to TRADERS' RESOURCE. | |
Click here for more information about our publications!
Comments
Date: 08/13/09Rank: 3Comment:

Request Information From Our Sponsors
- StockCharts.com, Inc.
- Candle Patterns
- Candlestick Charting Explained
- Intermarket Technical Analysis
- John Murphy on Chart Analysis
- John Murphy's Chart Pattern Recognition
- John Murphy's Market Message
- MurphyExplainsMarketAnalysis-Intermarket Analysis
- MurphyExplainsMarketAnalysis-Visual Analysis
- StockCharts.com
- Technical Analysis of the Financial Markets
- The Visual Investor
- VectorVest, Inc.
- Executive Premier Workshop
- One-Day Options Course
- OptionsPro
- Retirement Income Workshop
- Sure-Fire Trading Systems (VectorVest, Inc.)
- Trading as a Business Workshop
- VectorVest 7 EOD
- VectorVest 7 RealTime/IntraDay
- VectorVest AutoTester
- VectorVest Educational Services
- VectorVest OnLine
- VectorVest Options Analyzer
- VectorVest ProGraphics v6.0
- VectorVest ProTrader 7
- VectorVest RealTime Derby Tool
- VectorVest Simulator
- VectorVest Variator
- VectorVest Watchdog
