HOT TOPICS LIST
- MACD
- Fibonacci
- RSI
- Gann
- ADXR
- Stochastics
- Volume
- Triangles
- Futures
- Cycles
- Volatility
- ZIGZAG
- MESA
- Retracement
- Aroon
INDICATORS LIST
LIST OF TOPICS
PRINT THIS ARTICLE
by Dennis D. Peterson
Inverting charts can occasionally help make chart reading easier.
Position: N/A
Dennis D. Peterson
Market index trading on a daily basis.
PRINT THIS ARTICLE
TECHNICAL ANALYSIS
Inverted Charts
10/02/01 04:25:23 PMby Dennis D. Peterson
Inverting charts can occasionally help make chart reading easier.
Position: N/A
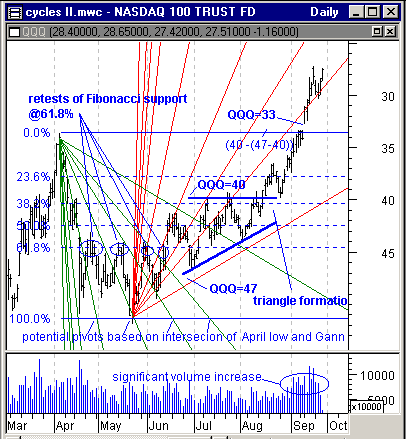
| There seem to be times when a chart is a little easier to read if you turn it upside down. I think the recent daily QQQ chart makes a good case for this. I will refer to chart elements, such as peaks, by qualifying them by saying they are "inverted peaks," meaning the peaks seen in the inverted chart are actually valleys. Notice that the price scale of Figure 1 starts at 45 at the bottom and rises to 30. I added Gann fans, green and red fan lines, at a peak and valley, using rises and runs of 16x16 and -16x16. I also added Fibonacci retracements levels as well. |
| The first thing I noticed when I inverted the chart was an ascending triangle, which of course is actually a descending triangle. The base of the triangle, in late June, gives a measure of the expected move when the triangle completes its formation. With a base defined at QQQ=40 and QQQ=47, you expect a move of 7 points to QQQ=33, before resistance (support in reality), is reached again. QQQ=33 also happens to coincide with a pivot point high on this inverted chart on 4/04. From a chart standpoint it would not be unreasonable to see a gap at QQQ=33. The price action following 9/11from an inverted standpoint is a failed upthrust (see posting "Pivots" on 6/05/01), meaning price should continue on its current trend. |

|
| Figure 1: Daily QQQ price and volume – Inverted. Price is reversed. If it weren’t for the fact that the chart is inverted, you would conclude this stock is definitely bullish. A green Gann fan is attached to the inverted peak at 4/04, while a red Gann fan is attached to an inverted low on 5/22. Fibonacci retracement (horizontal blue solid and dashed lines) are created by attaching 0% at 4/04 inverted peak and 100% at 5/22 inverted low. An inverted ascending triangle is seen and the outcome is not unexpected. |
| Graphic provided by: MetaStock. |
| Graphic provided by: Data vendor: eSignal<. |
| |
| When I inserted the Fibonacci retracement levels (Figure 1: horizontal blue solid and dashed lines), putting 0% on 4/04 and 100% on the inverted low of 5/22, I saw four (Figure 1, blue ovals) attempts to break the inverted resistance at the Fibonacci support/resistance level of 61.8%. Odds favor that when a horizontal support or resistance level is continually retested that price will move in the direction of the retests, which in this case meant in actuality that price was going down, or visually on the inverted chart that price goes up. Notice too, the horizontal line of the triangle is nearly at a Fibonacci level of 38.2%. This means QQQ is behaving in a predictable fashion. I next attached Gann fans at an inverted peak at 4/04, and at an inverted valley at 5/22. Because the chart is inverted, the rise x run for the inverted peak is 16x16, while the rise x run is -16x16 for the inverted valley. Immediately I noticed that if I had put the 100% Fibonacci retracement line on the 4/18 inverted low of 43.2, the Gann fan from the 4/04 inverted peak provided possible intercept points with the 100% Fibonacci retracement level. I was encouraged that the outermost red Gann fan line was nearly at the same angle as the triangle support line. Encouraged because I still view Gann angles and fans with some skepticism. But what happened to QQQ in terms of price trend I do see frequently - there are just some charts that seem to be Gann-proof. No matches that I can find. What I didn't show was that a Fibonacci time zone started on 4/04, has a zone line that goes through 5/22. Quite a coincidence- Fibonacci time zone and Fibonacci retracement level and Gann fan all intersecting at the same point that a stock pivots. Not likely to happen you might say. (See posting on 4/02 "Gann and Fibonacci (Part I of III)" Figure 1 point I for another coincidence.) I suggest you use these potential pivots as candidates, and if price starts to turn, use them as a confirming signal. The soundest approach in technical analysis is to use independent techniques to confirm one another. Differentiating between setup and entry is one way to do this, and using Gann, I must admit, is on my list of confirming techniques, but because of my skepticism is still low. Another rule that could be helpful at this juncture is the following: when price enters a sideways consolidation pattern, to confirm whether the consolidation pattern is a reversal or continuation, price needs to move in one direction for at least the range of the consolidation pattern, when price leaves the pattern. |
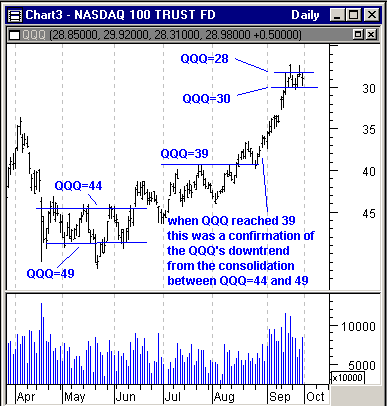
 Figure 2: QQQ Daily Price and Volume- Inverted. Consolidation ranges are a useful technique to confirm trend continuation or reversal. Add consolidation range to resistance to establish an upside target or subtract it from support for a downside target. In Figure 2 (an updated chart from Figure 1) price moved into a sideways consolidation pattern from mid-April to mid-June bouncing between QQQ=44 and QQQ=49. With a range of 5 points the target was 39. If QQQ went below 39 then there is confirmation that the downtrend is still intact. QQQ=39 is when QQQ started down on increased volume. From an inverted chart standpoint it looks bullish, but the increase in volume in actuality has a slight tinge of panic to it. It now appears another consolidation is forming between QQQ=28 and QQQ=30. If QQQ goes to 26 it is a sign it will go down further. If it goes to 32 then you will have an upswing; NOT necessarily a change in trend from down to up. The longer in time and broader in range a consolidation pattern, the greater its effect. Short, tight ranged consolidations bring about small changes. What you see, forgetting for the moment that the chart is inverted, is a stock that peaked on April (4/04), hit a low two weeks later (4/22), then tried to recover but met resistance at a Fibonacci level of 61.8%, consolidated, and met resistance at 38.2%. It went through a bullish ascending triangle, then gapped up at the point where the triangle predicted a move up. A move up that was a failed upthrust, confirmed a continuing move, and finally there appears to be a sideways consolidation. But a consolidation can be a continuation or reversal. This is a stock with some strength you would argue, making all the bullish moves you expect. Volume increased with the move up in September, and if this wasn't an inverted chart, traders would still seem to be comfortable with price. But being inverted, this shows selling with an edge of panic. The problem is this is an inverted chart and it's of a stock making all the sounds of a bear. |
Market index trading on a daily basis.
| Title: | Staff Writer |
| Company: | Technical Analysis, Inc. |
| Address: | 4757 California Ave SW |
| Seattle, WA 98116-4499 | |
| Phone # for sales: | 206 938 0570 |
| Fax: | 206 938 1307 |
| Website: | www.traders.com |
| E-mail address: | dpeterson@traders.com |
Traders' Resource Links | |
| Charting the Stock Market: The Wyckoff Method -- Books | |
| Working-Money.com -- Online Trading Services | |
| Traders.com Advantage -- Online Trading Services | |
| Technical Analysis of Stocks & Commodities -- Publications and Newsletters | |
| Working Money, at Working-Money.com -- Publications and Newsletters | |
| Traders.com Advantage -- Publications and Newsletters | |
| Professional Traders Starter Kit -- Software | |
Click here for more information about our publications!
Comments

|

Request Information From Our Sponsors
- StockCharts.com, Inc.
- Candle Patterns
- Candlestick Charting Explained
- Intermarket Technical Analysis
- John Murphy on Chart Analysis
- John Murphy's Chart Pattern Recognition
- John Murphy's Market Message
- MurphyExplainsMarketAnalysis-Intermarket Analysis
- MurphyExplainsMarketAnalysis-Visual Analysis
- StockCharts.com
- Technical Analysis of the Financial Markets
- The Visual Investor
- VectorVest, Inc.
- Executive Premier Workshop
- One-Day Options Course
- OptionsPro
- Retirement Income Workshop
- Sure-Fire Trading Systems (VectorVest, Inc.)
- Trading as a Business Workshop
- VectorVest 7 EOD
- VectorVest 7 RealTime/IntraDay
- VectorVest AutoTester
- VectorVest Educational Services
- VectorVest OnLine
- VectorVest Options Analyzer
- VectorVest ProGraphics v6.0
- VectorVest ProTrader 7
- VectorVest RealTime Derby Tool
- VectorVest Simulator
- VectorVest Variator
- VectorVest Watchdog
