HOT TOPICS LIST
- MACD
- Fibonacci
- RSI
- Gann
- ADXR
- Stochastics
- Volume
- Triangles
- Futures
- Cycles
- Volatility
- ZIGZAG
- MESA
- Retracement
- Aroon
INDICATORS LIST
LIST OF TOPICS
PRINT THIS ARTICLE
by Chaitali Mohile
The Materials Select Sector has recently broken through the resistance area and is heading toward another solid hurdle. Let us check out the reliability of the new rally.
Position: Buy
Chaitali Mohile
Active trader in the Indian stock markets since 2003 and a full-time writer. Trading is largely based upon technical analysis.
PRINT THIS ARTICLE
BREAKOUTS
XLB Breakout Rally
08/07/09 12:39:30 PMby Chaitali Mohile
The Materials Select Sector has recently broken through the resistance area and is heading toward another solid hurdle. Let us check out the reliability of the new rally.
Position: Buy
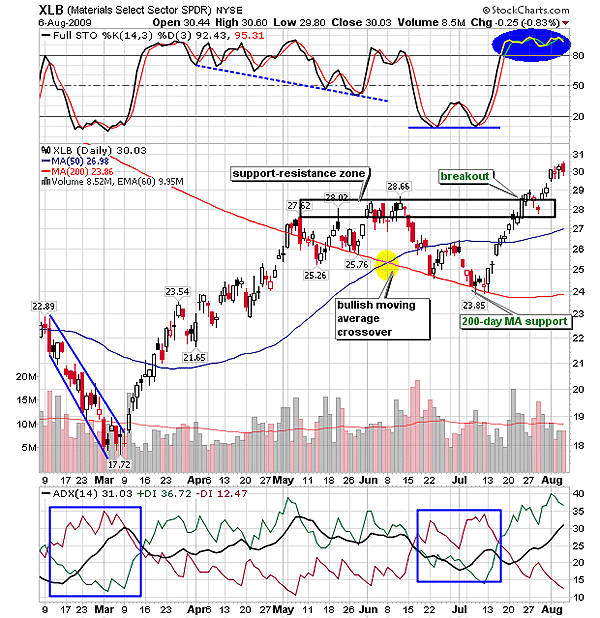
| An intermediate downtrend for the Materials Select Sector SPDR (XLB) reversed in early March with a bullish breakout of the falling wedge on the daily chart in Figure 1. Thereafter, the bull's trend developed stronger and the price movement improved gradually. The 200-day and the 50-day moving average (MA) resistance were converted to support after a bullish crossover. The descending 200-day MA offered strong support to the lower lows formed by the price movement. Similarly, the full stochastic (14,3,3) formed a series of lower lows within the bullish area before diving deeper in an oversold region. The oscillator formed a double bottom below 20 levels, initiating a new upward rally and positive momentum. The retesting of the 200-day MA support also reversed uptrend; see the second blue box in Figure 1. The average directional movement index (ADX) (14) slipped below 25 levels, but the selling pressure surged dramatically, and hence, the short-term downtrend was developed for the second time. |

|
| FIGURE 1: XLB, DAILY. The stock has surged above the tricky support-resistance area between $27 and $28. The movement of stochastic (14,3,3) in an overbought area, and the developed uptrend suggests a healthy breakout rally. |
| Graphic provided by: StockCharts.com. |
| |
| But the fresh rally with the strong support of the 200-day MA regenerated the bullish momentum and the uptrend was resumed. Eventually, the upper support-resistance zone of $27 and $28 (marked with a rectangular block) was breached with encouraging volume. The stochastic oscillator moved horizontally, indicating the stability of the breakout rally. In Figure 1, the small candlesticks above the upper range suggest slow growth as the volume failed to improve. This remains the point of concern. The weekly chart in Figure 2 might bring forward the reason. |

|
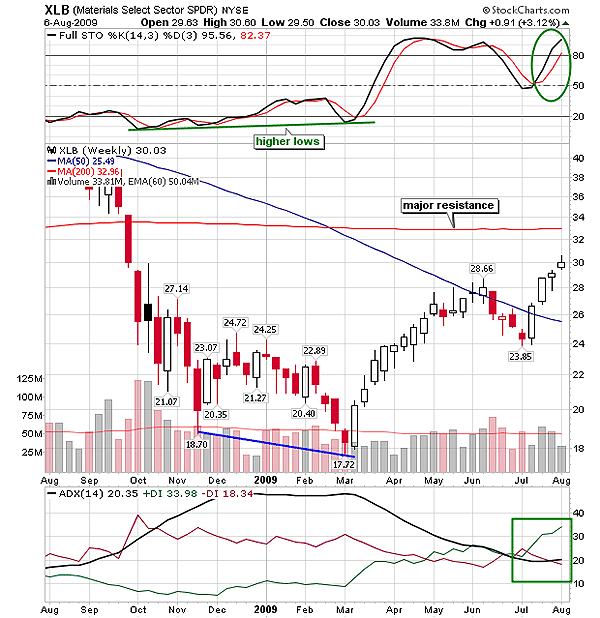
| FIGURE 2: XLB, WEEKLY. The 200-day MA resistance is the immediate hurdle for the current bullish rally. |
| Graphic provided by: StockCharts.com. |
| |
| When XLB formed the lower low at $17.72 on the price chart, the ADX (14) was highly overheated and the full stochastic (14,3,3) formed a higher bottom. Therefore, the positive divergence of the stochastic oscillator and the overheated downtrend resulted in a bullish reversal rally. XLB formed a bullish engulfing pattern at the bottom, indicating a fresh upward rally under way. Thereafter, XLB surged higher and higher until the 50-day MA resistance was hit. The upward move was suppressed due to this resistance. Later in Figure 2, the descending downtrend turned weaker, showing the possibility of a new uptrend. The stochastic that was declining rushed upward after establishing support at the 50 levels. Thus, the bullish scenario initiated a fresh bullish rally and turned the 50-day MA resistance to support. |
| XLB has the next resistance of the 200-day MA, which is also the intermediate target of the current rally. The sector has moved much closer to resistance, and the new uptrend is at a developing stage. These might be the reasons for the slow growth of the rally. But the long-term conditions for XLB would remain bullish. Therefore, traders can remain long till the rally hits the MA resistance at $32. XLB might consolidate under the resistance, forming a bullish consolidation pattern. But we cannot anticipate the pattern formation, so profit-booking would be the right decision. |
Active trader in the Indian stock markets since 2003 and a full-time writer. Trading is largely based upon technical analysis.
| Company: | Independent |
| Address: | C1/3 Parth Indraprasth Towers. Vastrapur |
| Ahmedabad, Guj 380015 | |
| E-mail address: | chaitalimohile@yahoo.co.in |
Traders' Resource Links | |
| Independent has not added any product or service information to TRADERS' RESOURCE. | |
Click here for more information about our publications!
Comments
Date: 08/10/09Rank: 4Comment:

Request Information From Our Sponsors
- StockCharts.com, Inc.
- Candle Patterns
- Candlestick Charting Explained
- Intermarket Technical Analysis
- John Murphy on Chart Analysis
- John Murphy's Chart Pattern Recognition
- John Murphy's Market Message
- MurphyExplainsMarketAnalysis-Intermarket Analysis
- MurphyExplainsMarketAnalysis-Visual Analysis
- StockCharts.com
- Technical Analysis of the Financial Markets
- The Visual Investor
- VectorVest, Inc.
- Executive Premier Workshop
- One-Day Options Course
- OptionsPro
- Retirement Income Workshop
- Sure-Fire Trading Systems (VectorVest, Inc.)
- Trading as a Business Workshop
- VectorVest 7 EOD
- VectorVest 7 RealTime/IntraDay
- VectorVest AutoTester
- VectorVest Educational Services
- VectorVest OnLine
- VectorVest Options Analyzer
- VectorVest ProGraphics v6.0
- VectorVest ProTrader 7
- VectorVest RealTime Derby Tool
- VectorVest Simulator
- VectorVest Variator
- VectorVest Watchdog
