HOT TOPICS LIST
- MACD
- Fibonacci
- RSI
- Gann
- ADXR
- Stochastics
- Volume
- Triangles
- Futures
- Cycles
- Volatility
- ZIGZAG
- MESA
- Retracement
- Aroon
INDICATORS LIST
LIST OF TOPICS
PRINT THIS ARTICLE
by Koos van der Merwe
The saying goes that one peek into the future is worth 1,000 finesses, so does our Elliott wave count give us that peek?
Position: Buy
Koos van der Merwe
Has been a technical analyst since 1969, and has worked as a futures and options trader with First Financial Futures in Johannesburg, South Africa.
PRINT THIS ARTICLE
ELLIOTT WAVE
An Elliott Wave Count Of The S&P 500
08/07/09 12:27:17 PMby Koos van der Merwe
The saying goes that one peek into the future is worth 1,000 finesses, so does our Elliott wave count give us that peek?
Position: Buy
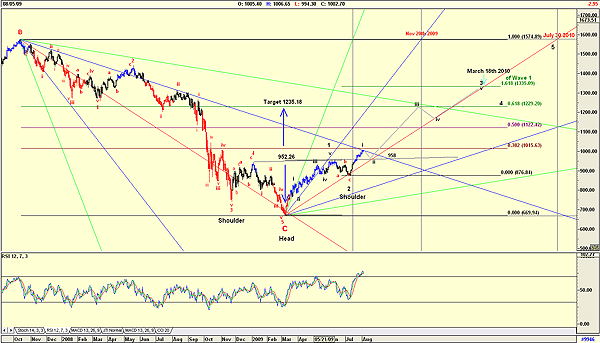
| I have always believed that an Elliott wave count on a chart is a peek at what the road ahead could bring, but -- and this is a big "but" -- one should always be prepared for the signpost ahead that can lead one in a different direction. My wave count shown in Figure 1 shows the historical count, which appears correct, leads one to the future count, which can change tomorrow. One thing is clear, though, and that is that the S&P 500 is in a new bull market. Whether it has completed wave 1 of a new uptrend impulse wave is open to conjecture. |

|
| FIGURE 1: S&P 500, MONTHLY |
| Graphic provided by: AdvancedGET. |
| |
| Figure 1 shows the following: a. An Elliott Wave count of wave C, which by all accounts is correct. This count confirms the end of the bear market, and the start of the new bull market. b. The rise from the low of wave C in waves 1 and 2, which form the right shoulder of an inverse head & shoulder pattern. This pattern suggests a target of 1235.18. c. This shoulder could be suspect for the following reasons: 1. The retracement of wave 2 that formed the shoulder appears to be mild. 2. The relative strength index (RSI) is strongly overbought at current levels, not at the level marked on the chart as the top of wave 1. 3. The current high of 1006.65 is testing the 38.2% Fibonacci retracement level from the high of wave B to the low of wave C. Labeling this level as wave -1, however, does not allow a true Elliott count, which is why I feel it could be wave -1 of wave -3. This count will hold, should the index test and bounce off the neckline at 958. d. What is interesting is that the target of 1235.18 suggested by the inverse head & shoulder pattern is the same level as the 61.8% retracement of the fall from wave -B to wave -C. e. In the chart I have suggested that this level, that is, 1235.18, could be wave iii of wave 3, but should the pattern change as the S&P rises, this level could easily become wave -1 of the new bull market. The reason for this is the Gann fan. Note how the fan has acted as good resistance and support levels as the index fell. This suggests that it could act as solid support and resistance levels on the way up; in fact, the right shoulder found support on the 1x1 angle. f. Finally, do note the dates, November 20, 2009, and July 30, 2010. These are date projections for corrections as the index rises. What the wave count will be at these dates is open to speculation, although I have suggested a wave count on the chart. g. Finally, I have suggested March 18, 2010, as the top of what could be wave 3. This level is 1.618% of the length of wave 1, and projecting it along the 1x1 Gann line, suggests this level. I have offered readers an Elliott wave count of the S&P 500, with a projection into the future. The Elliott wave projection can change at a moment's notice as the future unravels itself; however, the dates should be dates to keep in mind. |
Has been a technical analyst since 1969, and has worked as a futures and options trader with First Financial Futures in Johannesburg, South Africa.
| Address: | 3256 West 24th Ave |
| Vancouver, BC | |
| Phone # for sales: | 6042634214 |
| E-mail address: | petroosp@gmail.com |
Click here for more information about our publications!
Comments
Date: 08/10/09Rank: 4Comment:

|

Request Information From Our Sponsors
- StockCharts.com, Inc.
- Candle Patterns
- Candlestick Charting Explained
- Intermarket Technical Analysis
- John Murphy on Chart Analysis
- John Murphy's Chart Pattern Recognition
- John Murphy's Market Message
- MurphyExplainsMarketAnalysis-Intermarket Analysis
- MurphyExplainsMarketAnalysis-Visual Analysis
- StockCharts.com
- Technical Analysis of the Financial Markets
- The Visual Investor
- VectorVest, Inc.
- Executive Premier Workshop
- One-Day Options Course
- OptionsPro
- Retirement Income Workshop
- Sure-Fire Trading Systems (VectorVest, Inc.)
- Trading as a Business Workshop
- VectorVest 7 EOD
- VectorVest 7 RealTime/IntraDay
- VectorVest AutoTester
- VectorVest Educational Services
- VectorVest OnLine
- VectorVest Options Analyzer
- VectorVest ProGraphics v6.0
- VectorVest ProTrader 7
- VectorVest RealTime Derby Tool
- VectorVest Simulator
- VectorVest Variator
- VectorVest Watchdog
