HOT TOPICS LIST
- MACD
- Fibonacci
- RSI
- Gann
- ADXR
- Stochastics
- Volume
- Triangles
- Futures
- Cycles
- Volatility
- ZIGZAG
- MESA
- Retracement
- Aroon
INDICATORS LIST
LIST OF TOPICS
PRINT THIS ARTICLE
by Chaitali Mohile
After many volatile trading sessions, Alcoa Inc. is on the verge of stepping into a steady bullish environment. The strong trend reversal pattern is likely to increase the demand for the stock.
Position: Buy
Chaitali Mohile
Active trader in the Indian stock markets since 2003 and a full-time writer. Trading is largely based upon technical analysis.
PRINT THIS ARTICLE
HEAD & SHOULDERS
Sunny Days For Alcoa
08/05/09 01:46:50 PMby Chaitali Mohile
After many volatile trading sessions, Alcoa Inc. is on the verge of stepping into a steady bullish environment. The strong trend reversal pattern is likely to increase the demand for the stock.
Position: Buy
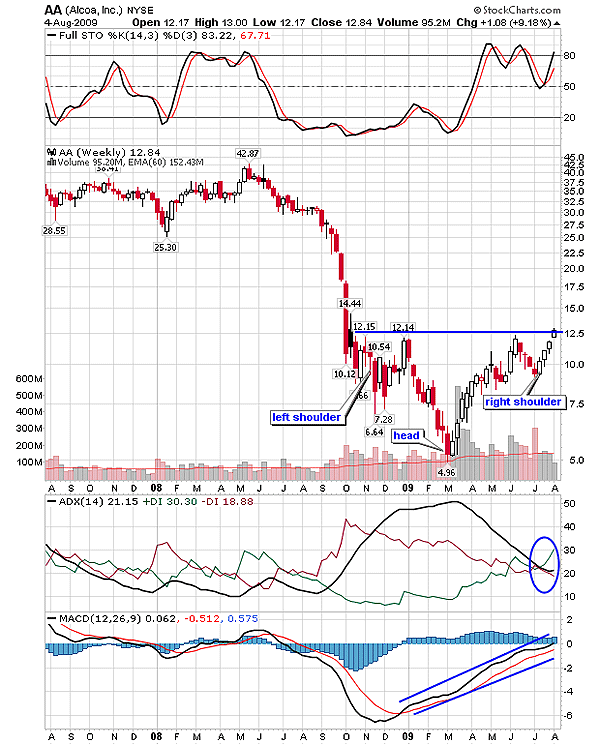
| Alcoa Inc. (AA) heavily lost its stock value in the financial markets across the world. By November 2008, AA reached a new low at $6.64 and the next was at an all-time low of $4.96 in March 2009. After these two lower lows in Figure 1, AA formed a higher bottom at about $9. The price action on the weekly chart in Figure 1 constructed an inverted head & shoulders -- a major trend reversal formation. The first low at $6.64 is the left shoulder, while the lower trough at $4.96 is the head, and the right shoulder of the pattern was formed at $9. The upward movement of AA from these lows was restricted at $12, marking the level as a neckline resistance. The average direction index (ADX) (14) in Figure 1 shows that the stock was in a significant downtrend during this price action. Therefore, the stock has fulfilled the required conditions for a valid inverted head & shoulders pattern. |

|
| FIGURE 1: AA, WEEKLY. The downtrend of AA would reverse with the bullish breakout of the inverted head & shoulders pattern. |
| Graphic provided by: StockCharts.com. |
| |
| Recently, the right shoulder has been completed, and the next bullish weekly opening above $12.50 would breach the neckline resistance. AA would soon undergo a bullish breakout. With Figure 1 as a weekly time frame, traders should consider buying the stock with the long-term perspective. The potential target for the inverted head & shoulders formation is calculated by adding the distance between the head and the neckline to the breakout level; 12 - 4.96 = 7.04 is the length of the head from the neckline, and therefore adding 7.04 to the neckline at 12 gives you the minimum estimated level of $19.04. After a long period of a year and half, the demand for the stock is likely to improve with the trend reversal pattern breakout. |
| You can see that the ADX (14) is ready to surge above the 20 levels in Figure 1. The buying pressure would gradually increase following the price breakout. The full stochastic (14,3,3) is comfortably rallying in a bullish area between 50 and 80. The moving average convergence/divergence (MACD) (12,26,9) is equally positive and bullish. The momentum indicator has moved closer to the zero line and should soon shift to positive territory. Thus, the long position at the breakout level would definitely give handsome profits and the demand size would increase accordingly. |
Active trader in the Indian stock markets since 2003 and a full-time writer. Trading is largely based upon technical analysis.
| Company: | Independent |
| Address: | C1/3 Parth Indraprasth Towers. Vastrapur |
| Ahmedabad, Guj 380015 | |
| E-mail address: | chaitalimohile@yahoo.co.in |
Traders' Resource Links | |
| Independent has not added any product or service information to TRADERS' RESOURCE. | |
Click here for more information about our publications!
Comments
Date: 08/11/09Rank: 5Comment:

Request Information From Our Sponsors
- StockCharts.com, Inc.
- Candle Patterns
- Candlestick Charting Explained
- Intermarket Technical Analysis
- John Murphy on Chart Analysis
- John Murphy's Chart Pattern Recognition
- John Murphy's Market Message
- MurphyExplainsMarketAnalysis-Intermarket Analysis
- MurphyExplainsMarketAnalysis-Visual Analysis
- StockCharts.com
- Technical Analysis of the Financial Markets
- The Visual Investor
- VectorVest, Inc.
- Executive Premier Workshop
- One-Day Options Course
- OptionsPro
- Retirement Income Workshop
- Sure-Fire Trading Systems (VectorVest, Inc.)
- Trading as a Business Workshop
- VectorVest 7 EOD
- VectorVest 7 RealTime/IntraDay
- VectorVest AutoTester
- VectorVest Educational Services
- VectorVest OnLine
- VectorVest Options Analyzer
- VectorVest ProGraphics v6.0
- VectorVest ProTrader 7
- VectorVest RealTime Derby Tool
- VectorVest Simulator
- VectorVest Variator
- VectorVest Watchdog
