HOT TOPICS LIST
- MACD
- Fibonacci
- RSI
- Gann
- ADXR
- Stochastics
- Volume
- Triangles
- Futures
- Cycles
- Volatility
- ZIGZAG
- MESA
- Retracement
- Aroon
INDICATORS LIST
LIST OF TOPICS
PRINT THIS ARTICLE
by Koos van der Merwe
The recent head & shoulders pattern of the DJIA appears to have failed. This should not put you off H&S analysis. Here's a stock with an inverse H&S pattern that looks very interesting.
Position: Accumulate
Koos van der Merwe
Has been a technical analyst since 1969, and has worked as a futures and options trader with First Financial Futures in Johannesburg, South Africa.
PRINT THIS ARTICLE
HEAD & SHOULDERS
CBS, A Stock To Watch
08/05/09 11:22:04 AMby Koos van der Merwe
The recent head & shoulders pattern of the DJIA appears to have failed. This should not put you off H&S analysis. Here's a stock with an inverse H&S pattern that looks very interesting.
Position: Accumulate
| CBS Corp. is a mass media company that has various connections to the dawn of the broadcast industry as well as newer businesses that operate at the leading edge of the media industry. According to the company, it "combines broad reach with well-positioned local businesses, all of which provide it with an extensive distribution network by which it serves audiences and advertisers in all 50 states and key international markets. It has operations in virtually every field of media and entertainment," including broadcast TV, cable TV, local TV, production and syndication, radio, publishing, and more. On July 31, the company announced that its board of directors had approved a quarterly dividend on the company's common stock of $0.05 per share, payable on October 1, 2009, to shareholders of record as of September 10, 2009. |

|
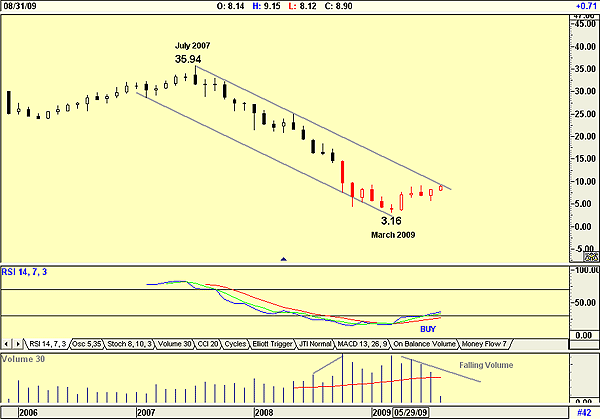
| FIGURE 1: CBS CORP., MONTHLY |
| Graphic provided by: AdvancedGET. |
| |
| Figure 1, a monthly chart, shows how the price has fallen from a high of $35.94 in July 2007 to a low of $3.16 by March 2009. Since then, the price has risen to its present value of $8.95. The chart shows the following: a. The current price is testing the downward resistance trendline. b. The relative strength index (RSI) has given a buy signal. c. Volume has been falling as the share price rises, suggesting the stock may find the trendline to be a strong resistance line. |

|
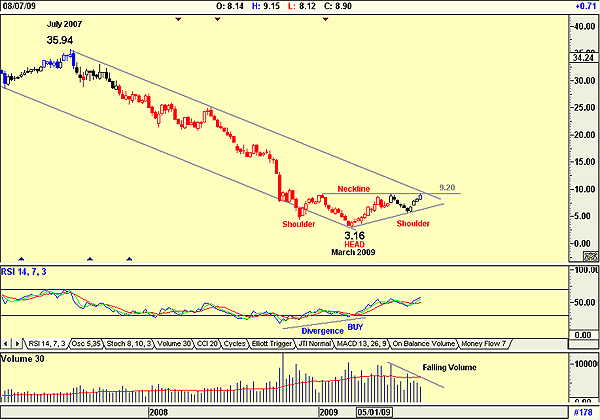
| FIGURE 2: CBS CORP., WEEKLY |
| Graphic provided by: AdvancedGET. |
| |
| Figure 2, a weekly chart, shows the inverse head & shoulders pattern that has formed, suggesting a neckline at $9.20, a figure that also acts as the resistance of the downward trendline. The RSI suggests a divergence buy, a strong signal, but the falling volume does suggest that there could still be weakness, as the price struggles to break the double resistance of the neckline and the trendline. |

|
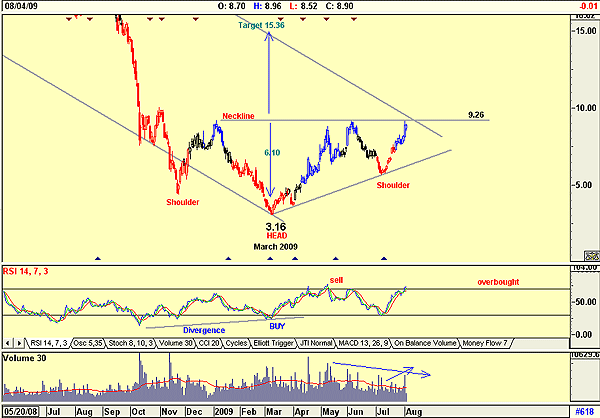
| FIGURE 3: CBS CORP., DAILY |
| Graphic provided by: AdvancedGET. |
| |
| Figure 3, a daily chart, shows the inverse head & shoulders that has formed. The chart also suggests a target of $15.36, should the price break above the neckline at $9.26 (9.26 - 3.16 = 6.10 + 9.26 = 15.36). The chart also shows an RSI at overbought levels, suggesting a retracement before a second attempt to break above the neckline should the first attempt fail. The chart does however show volume falling as the stock price fell, suggesting strength. Short-term volume is rising along with the stock price, also showing strength. The price of $9.26 seems to be a formidable resistance level, but a break above this level should see the price rise to $15.36. CBS is a stock that bears watching. |
Has been a technical analyst since 1969, and has worked as a futures and options trader with First Financial Futures in Johannesburg, South Africa.
| Address: | 3256 West 24th Ave |
| Vancouver, BC | |
| Phone # for sales: | 6042634214 |
| E-mail address: | petroosp@gmail.com |
Click here for more information about our publications!
Comments
Date: 08/10/09Rank: 5Comment:

Request Information From Our Sponsors
- StockCharts.com, Inc.
- Candle Patterns
- Candlestick Charting Explained
- Intermarket Technical Analysis
- John Murphy on Chart Analysis
- John Murphy's Chart Pattern Recognition
- John Murphy's Market Message
- MurphyExplainsMarketAnalysis-Intermarket Analysis
- MurphyExplainsMarketAnalysis-Visual Analysis
- StockCharts.com
- Technical Analysis of the Financial Markets
- The Visual Investor
- VectorVest, Inc.
- Executive Premier Workshop
- One-Day Options Course
- OptionsPro
- Retirement Income Workshop
- Sure-Fire Trading Systems (VectorVest, Inc.)
- Trading as a Business Workshop
- VectorVest 7 EOD
- VectorVest 7 RealTime/IntraDay
- VectorVest AutoTester
- VectorVest Educational Services
- VectorVest OnLine
- VectorVest Options Analyzer
- VectorVest ProGraphics v6.0
- VectorVest ProTrader 7
- VectorVest RealTime Derby Tool
- VectorVest Simulator
- VectorVest Variator
- VectorVest Watchdog
