HOT TOPICS LIST
- MACD
- Fibonacci
- RSI
- Gann
- ADXR
- Stochastics
- Volume
- Triangles
- Futures
- Cycles
- Volatility
- ZIGZAG
- MESA
- Retracement
- Aroon
INDICATORS LIST
LIST OF TOPICS
PRINT THIS ARTICLE
by David Penn
SBC Communications has been struggling to put in a bottom since falling from nearly 60 per share in November 2000 to under 40 by April 2001.
Position: N/A
David Penn
Technical Writer for Technical Analysis of STOCKS & COMMODITIES magazine, Working-Money.com, and Traders.com Advantage.
PRINT THIS ARTICLE
HEAD & SHOULDERS
SBC's Head and Shoulders Bottom
09/21/01 11:49:57 AMby David Penn
SBC Communications has been struggling to put in a bottom since falling from nearly 60 per share in November 2000 to under 40 by April 2001.
Position: N/A
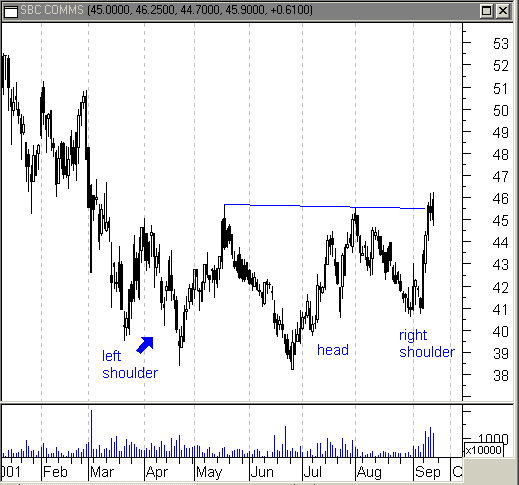
| When I first took a look at SBC Communications, the stock appeared to be climbing the right side of the right shoulder of a head and shoulders bottom. Since then, even in the midst of major hemorrhaging in the stock market, SBC has gained 5% as it surpasses previous intermediate highs from May and July. If it is true that, when the smoke clears, it will be the blue chip stocks that do better than the rest, then SBC is as likely to lead the way out of the basement as any other component of the Dow Jones Industrials. |
| As noted at the outset, SBC has been working hard to establish a bottom in the high 30s. The first test of the area, in April, features a long bullish lower shadow that would signify that a rally was close by. Similarly, a second attempt to put in a final bottom came in mid-June. However this decline was met by a very bullish piercing candlestick (see chart) which again suggested that a rally was right around the corner. The third significant attempt to move lower came in late August as prices declined from about 45 to 41. Again, buyers stepped in to bid shares back toward the 45.5 area, which had been effective resistance since mid-March. |

|
| In the middle of major declines in the Dow Jones Industrials, Dow component SBC looks to breakout from this head and shoulders bottom. |
| Graphic provided by: MetaStock. |
| |
| The fact that SBC may actually be breaking out above 45.5--and on rising volume, at that--is pretty remarkable, given the way the Dow has performed. It isn't hard to believe that when the "relief rally" (or the oversold rally) arrives, stocks like SBC that had held up during the Dow's sell-off may be rewarded with more buyers. Such a development becomes all the more believable in the context of SBC's head and shoulders bottom. |
| The head and shoulders bottom is a bullish reversal pattern. The pattern reflects a tradable's resilience in the face of repeated declines. When a tradable refuses to stay down, bearish sentiments starts to wane. Holders of the tradable become more confident that the declines may be over, and those new to the tradable often see a major opportunity on the long side. Thus, like the head and shoulders top, the breakout from a head and shoulders bottom can be powerful--as the realization that the downside may have completely disappeared causes a sea-change in investor sentiment toward the tradable. |
| Looking more closely at SBC Communications, we can derive a formation height of approximately eight by subtracing the value at the low point in the formation (38.5) from the value at the neckline, or resistance point (45.5). Adding the formation height to the value at the neckline provides an upside price target of as much as 53.5. This would represent a 17% gain from the breakout point at 45.5. It should be added that SBC spent a little over five months developing this head and shoulders bottom. Thus a quick trip to 53 is unlikely. Still, if SBC does continue its upward movement (its most recent close was 45.9, just above the neckline), it may represent to the savvy trader one of the few opportunities for gains on the long side in a market that has been a world of hurt for everyone but the shorts. |
Technical Writer for Technical Analysis of STOCKS & COMMODITIES magazine, Working-Money.com, and Traders.com Advantage.
| Title: | Technical Writer |
| Company: | Technical Analysis, Inc. |
| Address: | 4757 California Avenue SW |
| Seattle, WA 98116 | |
| Phone # for sales: | 206 938 0570 |
| Fax: | 206 938 1307 |
| Website: | www.Traders.com |
| E-mail address: | DPenn@traders.com |
Traders' Resource Links | |
| Charting the Stock Market: The Wyckoff Method -- Books | |
| Working-Money.com -- Online Trading Services | |
| Traders.com Advantage -- Online Trading Services | |
| Technical Analysis of Stocks & Commodities -- Publications and Newsletters | |
| Working Money, at Working-Money.com -- Publications and Newsletters | |
| Traders.com Advantage -- Publications and Newsletters | |
| Professional Traders Starter Kit -- Software | |
Click here for more information about our publications!
Comments

|

Request Information From Our Sponsors
- StockCharts.com, Inc.
- Candle Patterns
- Candlestick Charting Explained
- Intermarket Technical Analysis
- John Murphy on Chart Analysis
- John Murphy's Chart Pattern Recognition
- John Murphy's Market Message
- MurphyExplainsMarketAnalysis-Intermarket Analysis
- MurphyExplainsMarketAnalysis-Visual Analysis
- StockCharts.com
- Technical Analysis of the Financial Markets
- The Visual Investor
- VectorVest, Inc.
- Executive Premier Workshop
- One-Day Options Course
- OptionsPro
- Retirement Income Workshop
- Sure-Fire Trading Systems (VectorVest, Inc.)
- Trading as a Business Workshop
- VectorVest 7 EOD
- VectorVest 7 RealTime/IntraDay
- VectorVest AutoTester
- VectorVest Educational Services
- VectorVest OnLine
- VectorVest Options Analyzer
- VectorVest ProGraphics v6.0
- VectorVest ProTrader 7
- VectorVest RealTime Derby Tool
- VectorVest Simulator
- VectorVest Variator
- VectorVest Watchdog
