HOT TOPICS LIST
- MACD
- Fibonacci
- RSI
- Gann
- ADXR
- Stochastics
- Volume
- Triangles
- Futures
- Cycles
- Volatility
- ZIGZAG
- MESA
- Retracement
- Aroon
INDICATORS LIST
LIST OF TOPICS
PRINT THIS ARTICLE
by Chaitali Mohile
The NASDAQ 100 had a relatively strong bullish rally that conquered the lost sentiment. The index awaits another breakout near a technical resistance.
Position: Buy
Chaitali Mohile
Active trader in the Indian stock markets since 2003 and a full-time writer. Trading is largely based upon technical analysis.
PRINT THIS ARTICLE
TECHNICAL ANALYSIS
$NDX Hits Resistance
07/30/09 12:26:35 PMby Chaitali Mohile
The NASDAQ 100 had a relatively strong bullish rally that conquered the lost sentiment. The index awaits another breakout near a technical resistance.
Position: Buy
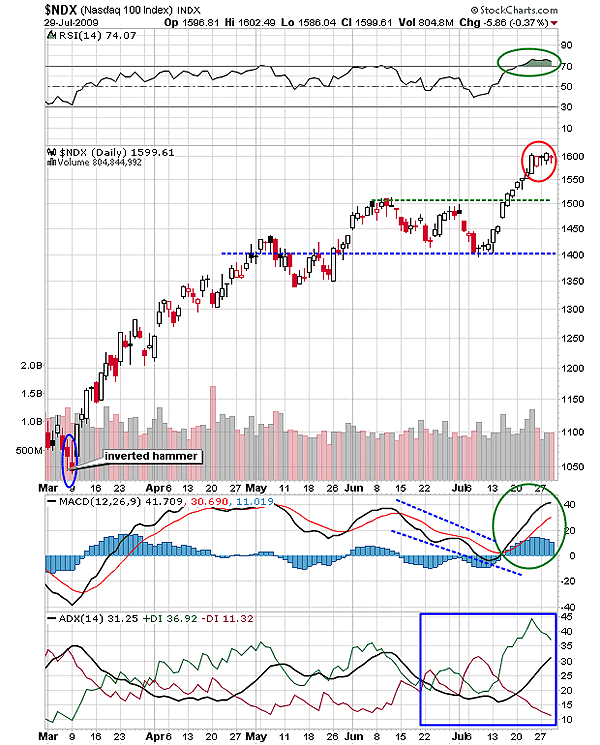
| The NASDAQ 100's ($NDX) upward journey has gradually gained 350 points over the past five months. According to the daily chart in Figure 1, 1050 was the low made by the inverted hammer candlestick in March 2009, initiating a new uptrend for the index. The accelerated bullish run consolidated at 1450 and 1350 levels and gathered additional bullish strength in the existing move. The breakout rally at the 1450 level retraced to the newly formed support at 1400 level. This shows that $NDX was not overexcited for converting the various prior highs to supports. The rally from 1050 to 1550 consolidated twice, indicating positive and steady growth in the trader's sentiments. |
| The average directional movement index (ADX) (14) in Figure 1 has always sustained above the 15 level, preventing the trend entering the weaker section of the indicator. The buying and selling pressure indicated by the positive directional index (+DI) and the negative directional index (-DI) are shaky, indicating a struggle to establish their control over the rally. But the +DI has remained superior ever since the downtrend reversed. The relative strength index (RSI) (14) remained range-bound in an overbought area between 50 and 70, indicating stable bullish force. Thus, the overall technical picture was healthily bullish to lead the rally. |

|
| FIGURE 1: $NDX, DAILY. The RSI (14) is moving horizontally in an overbought area. As a result, the vertically upward rally moved sideways, forming the bullish flag & pennant continuation pattern. |
| Graphic provided by: StockCharts.com. |
| |
| However, the breakout above 1500 level (the green dotted line) in Figure 1 dragged the RSI (14) into a highly overbought region above 70. The indicator has the potential to move horizontally in this region for longer periods without harming the existing bullish touch of the rally. An overbought indicator does not always result in the decline. We can see that $NDX surged to 1600 and turned sideways. Due to the earlier consolidation (1500-1400), the moving average convergence/divergence (MACD) (12,26,9) descended within positive territory, and thereafter established support at the zero line. Here, the indicator went through a bullish crossover (see the dotted line and circle). Hence, the sideways action of the index is very well supported by the bullish indicators. The consolidation after the advance rally of 200 points formed a bullish flag & pennant continuation pattern. Technically, $NDX would defiantly undergo a bullish breakout with the target of 1600 - 1400 = 200 + 1600 = 1800. |

|
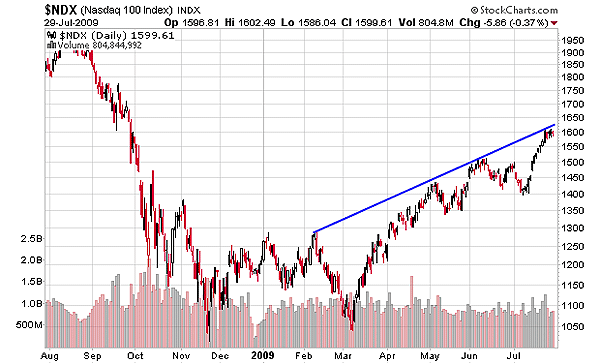
| FIGURE 2: $NDX, DAILY. The trendline resistance has suppressed the current bullish rally. The breakout would generate strong demand force. |
| Graphic provided by: StockCharts.com. |
| |
| Apart from the horizontally moving RSI (14) and an extensive 200-point advance rally, there is one more reason for the current consolidation. Figure 2 with year-old data shows the trendline resistance at the 1600 level. The trendline is drawn, connecting the higher highs of $NDX, which further turns to be one of the resistances for the current bullish rally. The series of higher peak formations is itself a bullish indication for any stock or index. |
| Therefore, the flag & pennant pattern breakout level and the trendline resistance coincide at the 1600 level. Thus, $NDX is ready to undergo the major breakout. This can generate a strong buy setup with the target of 1800. $NDX would consolidate during the journey so shifting your stop-loss can be a good strategy. |
Active trader in the Indian stock markets since 2003 and a full-time writer. Trading is largely based upon technical analysis.
| Company: | Independent |
| Address: | C1/3 Parth Indraprasth Towers. Vastrapur |
| Ahmedabad, Guj 380015 | |
| E-mail address: | chaitalimohile@yahoo.co.in |
Traders' Resource Links | |
| Independent has not added any product or service information to TRADERS' RESOURCE. | |
Click here for more information about our publications!
PRINT THIS ARTICLE

Request Information From Our Sponsors
- StockCharts.com, Inc.
- Candle Patterns
- Candlestick Charting Explained
- Intermarket Technical Analysis
- John Murphy on Chart Analysis
- John Murphy's Chart Pattern Recognition
- John Murphy's Market Message
- MurphyExplainsMarketAnalysis-Intermarket Analysis
- MurphyExplainsMarketAnalysis-Visual Analysis
- StockCharts.com
- Technical Analysis of the Financial Markets
- The Visual Investor
- VectorVest, Inc.
- Executive Premier Workshop
- One-Day Options Course
- OptionsPro
- Retirement Income Workshop
- Sure-Fire Trading Systems (VectorVest, Inc.)
- Trading as a Business Workshop
- VectorVest 7 EOD
- VectorVest 7 RealTime/IntraDay
- VectorVest AutoTester
- VectorVest Educational Services
- VectorVest OnLine
- VectorVest Options Analyzer
- VectorVest ProGraphics v6.0
- VectorVest ProTrader 7
- VectorVest RealTime Derby Tool
- VectorVest Simulator
- VectorVest Variator
- VectorVest Watchdog
