HOT TOPICS LIST
- MACD
- Fibonacci
- RSI
- Gann
- ADXR
- Stochastics
- Volume
- Triangles
- Futures
- Cycles
- Volatility
- ZIGZAG
- MESA
- Retracement
- Aroon
INDICATORS LIST
LIST OF TOPICS
PRINT THIS ARTICLE
by Chaitali Mohile
The bullish rally for the 99 Cents Only Stores temporarily halted due to the consolidation. Recently, the stock has broken through an upper range under moderate bearish signals.
Position: Buy
Chaitali Mohile
Active trader in the Indian stock markets since 2003 and a full-time writer. Trading is largely based upon technical analysis.
PRINT THIS ARTICLE
BREAKOUTS
NDN Above Consolidation Range
07/29/09 11:50:28 AMby Chaitali Mohile
The bullish rally for the 99 Cents Only Stores temporarily halted due to the consolidation. Recently, the stock has broken through an upper range under moderate bearish signals.
Position: Buy
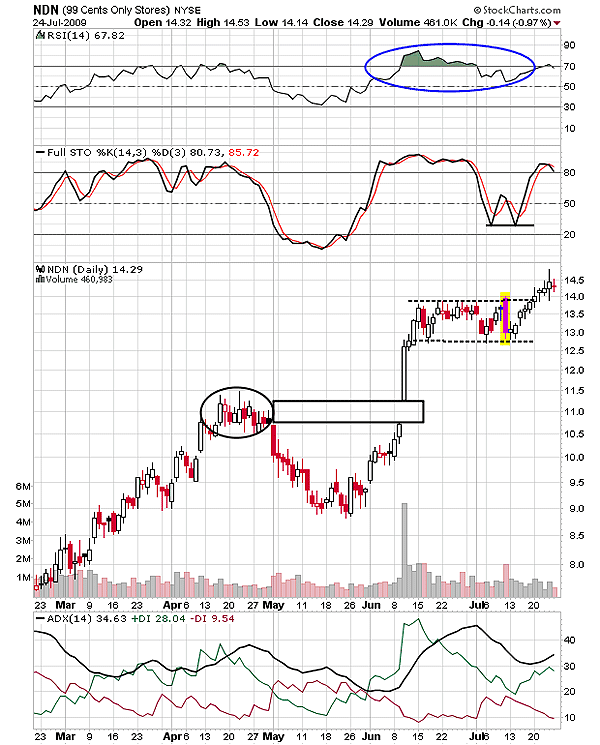
| The 99 Cents Only Store (NDN) is one of the reliable stocks with steady gains. The gap-up breakout of the prior highs (consolidation range marked in circle) initiated a fresh uptrend in June 2009. The sideways price action in April 2009 -- see the circle marking in Figure 1 -- formed a bullish flag & pennant continuation pattern. But the bullish pattern witnessed a trend reversal breakout in the bearish direction. The relative strength index (RSI) (14) indicated lack of strength to surge above the 70 levels, and the full stochastic (14,3,3) turned volatile in an overbought zone near 80 levels. Therefore, the oscillator failed to induce a bullish force in the rally. In addition, the average directional movement index (ADX) (14) slipped down from a developing uptrend level above 35. The cumulative effect: A pattern failure. |
| The bearish breakout established support near $9, and the rally reversed. The consolidation in a narrow range of $9 and $9.50 formed a shape of a rounded-bottom -- a bullish reversal pattern. NDN rushed upward with a small gap-up breakout in Figure 1, violating the resistance zone of previous consolidation range. A fresh buying setup was offered by the RSI (14) as well as by the stochastic oscillator above 50 levels and 20 levels, respectively. Both signals occurred simultaneously after the gap-up breakout, reconfirming the trading strategy. Gradually, NDN rallied higher to $14 and consolidated in a wide range of $14 and $12.50. The rectangle formed by the sideways movement developed bullish sentiments among traders for an upward breakout. But negative divergence of the RSI (14) gave way to volatility. We can see one long bearish candle (highlighted), and many small red and white candles with shadows in Figure 1, signifying volatility during consolidation. |

|
| FIGURE 1: NDN, DAILY. The weak RSI (14) and descending stochastic (14) would hold back the breakout rally. The uptrend would sustain even if the NDN may not surge immediately. |
| Graphic provided by: StockCharts.com. |
| |
| Later, a new upward move was born with the support of the lower range due to the double-bottom by the stochastic (14,3,3) in Figure 1. The ADX (14) that descended from an overheated level, took a U-turn from 30 levels and surged higher with robust buying pressure. Thus, as the uptrend was established, NDN breached the rectangle upward. But as we can see, after the breakout the stock showed reluctance in the rally. The stochastic (14,3,3) is likely to decline below the 80 level and the RSI (14) formed a lower high. Therefore, both indicators reflected bearish signs, restricting an upward price action. Although the ADX (14) is suggesting a developed uptrend, the stock retraced toward the newly formed support (the breakout level). NDN is likely to remain weak till the RSI (14) and the stochastic oscillator turn bullish. |
| The new long trade can be set near the support level at $14 once the stock gears up the existing rally. NDN would resume its bullish journey, sustain its reliability, and continue giving steady gains to traders. |
Active trader in the Indian stock markets since 2003 and a full-time writer. Trading is largely based upon technical analysis.
| Company: | Independent |
| Address: | C1/3 Parth Indraprasth Towers. Vastrapur |
| Ahmedabad, Guj 380015 | |
| E-mail address: | chaitalimohile@yahoo.co.in |
Traders' Resource Links | |
| Independent has not added any product or service information to TRADERS' RESOURCE. | |
Click here for more information about our publications!
PRINT THIS ARTICLE

Request Information From Our Sponsors
- StockCharts.com, Inc.
- Candle Patterns
- Candlestick Charting Explained
- Intermarket Technical Analysis
- John Murphy on Chart Analysis
- John Murphy's Chart Pattern Recognition
- John Murphy's Market Message
- MurphyExplainsMarketAnalysis-Intermarket Analysis
- MurphyExplainsMarketAnalysis-Visual Analysis
- StockCharts.com
- Technical Analysis of the Financial Markets
- The Visual Investor
- VectorVest, Inc.
- Executive Premier Workshop
- One-Day Options Course
- OptionsPro
- Retirement Income Workshop
- Sure-Fire Trading Systems (VectorVest, Inc.)
- Trading as a Business Workshop
- VectorVest 7 EOD
- VectorVest 7 RealTime/IntraDay
- VectorVest AutoTester
- VectorVest Educational Services
- VectorVest OnLine
- VectorVest Options Analyzer
- VectorVest ProGraphics v6.0
- VectorVest ProTrader 7
- VectorVest RealTime Derby Tool
- VectorVest Simulator
- VectorVest Variator
- VectorVest Watchdog
