HOT TOPICS LIST
- MACD
- Fibonacci
- RSI
- Gann
- ADXR
- Stochastics
- Volume
- Triangles
- Futures
- Cycles
- Volatility
- ZIGZAG
- MESA
- Retracement
- Aroon
INDICATORS LIST
LIST OF TOPICS
PRINT THIS ARTICLE
by Koos van der Merwe
With the oil and gas prices rising resulting in an increase in exploration, Trinidad Drilling looks interesting.
Position: Accumulate
Koos van der Merwe
Has been a technical analyst since 1969, and has worked as a futures and options trader with First Financial Futures in Johannesburg, South Africa.
PRINT THIS ARTICLE
ELLIOTT WAVE
Trinidad Drilling
07/29/09 09:06:17 AMby Koos van der Merwe
With the oil and gas prices rising resulting in an increase in exploration, Trinidad Drilling looks interesting.
Position: Accumulate
| Trinidad Drilling provides high-quality oil and gas drilling equipment with experienced personnel capable of drilling a broad range of exploration and production targets. They are focused toward the deeper drilling market providing the newest and most technically advanced rigs in the industry. In Canada, 53 drilling rigs are operational, and 56 in the United States. The company also operates four barge drilling rigs in the shallow waters of the Gulf of Mexico and seven drilling rigs in the Chicontepec region of Mexico. |

|
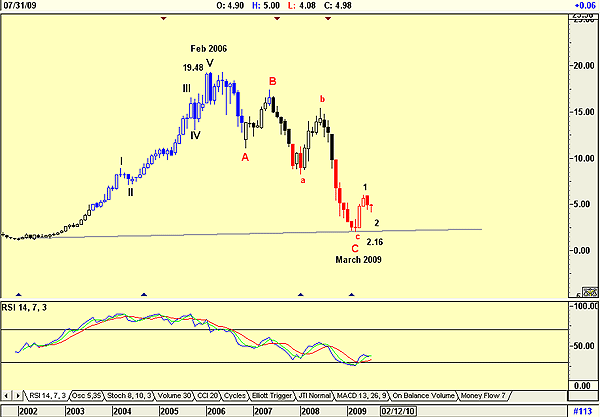
| FIGURE 1: TRINIDAD DRILLING, MONTHLY. The stock price has dropped from $19.48 in February 2006 to $2.16 by March 2009, in spite of oil prices rising. |
| Graphic provided by: AdvancedGET. |
| |
| Figure 1 is a monthly chart, showing how the stock price has fallen from $19.48 in February 2006 to $2.16 by March 2009, this in spite of an oil price rising to unbelievable heights over this period. We must remember, however, that the company provides equipment for exploration by other companies, or is it possible that the seven drilling rigs in the shallow waters of the Gulf of Mexico have not been that successful? Then again, we should look to the fundamentals, which may explain the reason for this collapse, but then, we are looking at the technicals and attempting to ascertain the future movement of the stock by this means. Whatever the reason for the collapse in the company's share price over this period, the stock price since March does look interesting. The relative strength index (RSI) has given a buy signal and is suggesting strength. The negative is the wave theory. An Elliott wave theory C-wave usually falls in five waves. Because of the RSI buy signal, the chart suggests a three-wave a-b-c correction. |

|
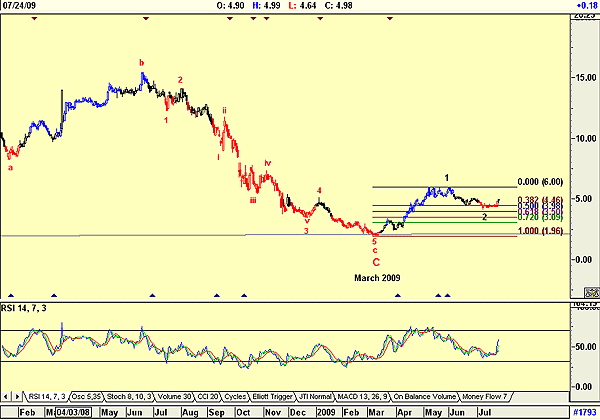
| FIGURE 2: TRINIDAD DRILLING, DAILY. This stock is worth watching at these numbers. |
| Graphic provided by: AdvancedGET. |
| |
| Figure 2, a daily chart, shows that wave c of wave C has indeed fallen in five waves, confirming the C-wave finality. The daily chart also suggests that the stock price has now moved into a wave 1 and a wave 2 of a new bull trend. The chart also suggests that wave-2 could have bottomed at the 38.2% Fibonacci level. The negative, of course, is the RSI, which has not given a definite buy signal. Trinidad Drilling is a stock worth watching . Traders who are prepared to take more risk could buy at present levels. |
Has been a technical analyst since 1969, and has worked as a futures and options trader with First Financial Futures in Johannesburg, South Africa.
| Address: | 3256 West 24th Ave |
| Vancouver, BC | |
| Phone # for sales: | 6042634214 |
| E-mail address: | petroosp@gmail.com |
Click here for more information about our publications!
Comments
Date: 08/04/09Rank: 5Comment:

Request Information From Our Sponsors
- StockCharts.com, Inc.
- Candle Patterns
- Candlestick Charting Explained
- Intermarket Technical Analysis
- John Murphy on Chart Analysis
- John Murphy's Chart Pattern Recognition
- John Murphy's Market Message
- MurphyExplainsMarketAnalysis-Intermarket Analysis
- MurphyExplainsMarketAnalysis-Visual Analysis
- StockCharts.com
- Technical Analysis of the Financial Markets
- The Visual Investor
- VectorVest, Inc.
- Executive Premier Workshop
- One-Day Options Course
- OptionsPro
- Retirement Income Workshop
- Sure-Fire Trading Systems (VectorVest, Inc.)
- Trading as a Business Workshop
- VectorVest 7 EOD
- VectorVest 7 RealTime/IntraDay
- VectorVest AutoTester
- VectorVest Educational Services
- VectorVest OnLine
- VectorVest Options Analyzer
- VectorVest ProGraphics v6.0
- VectorVest ProTrader 7
- VectorVest RealTime Derby Tool
- VectorVest Simulator
- VectorVest Variator
- VectorVest Watchdog
