HOT TOPICS LIST
- MACD
- Fibonacci
- RSI
- Gann
- ADXR
- Stochastics
- Volume
- Triangles
- Futures
- Cycles
- Volatility
- ZIGZAG
- MESA
- Retracement
- Aroon
INDICATORS LIST
LIST OF TOPICS
PRINT THIS ARTICLE
by David Penn
The latest declines for the airlines industry are only a continuation of a miserable year, as the S&P Airlines Index makes plain.
Position: N/A
David Penn
Technical Writer for Technical Analysis of STOCKS & COMMODITIES magazine, Working-Money.com, and Traders.com Advantage.
PRINT THIS ARTICLE
HEAD & SHOULDERS
The Airlines' Complex Head and Shoulders Top
09/21/01 01:09:48 PMby David Penn
The latest declines for the airlines industry are only a continuation of a miserable year, as the S&P Airlines Index makes plain.
Position: N/A
| The stock market no-brainer of the fall is obviously the fact that airlines stocks, in the wake of the terrorist attack on Tuesday, September 11th, are in trouble. Regardless of whatever bail-out program does or does not emerge from the U.S. Congress, one thing the Congress won't be able to replace (as a number of people have pointed out) are the passengers, who are likely to remain flight-averse for the foreseeable future. |
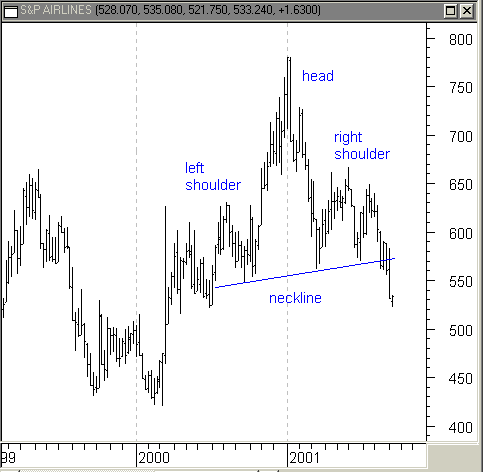
| But the fact of the matter is that the airlines group has been a correction just waiting for a collapse. After reaching a peak of 785 at the end of 2000, the S&P Airlines index dropped 200 points, or 25%, by March 2001. There were two successive rallies in the Airlines index in 2001: the first coming in the spring and the second in the summer. But neither rally was able to retrace more than half of the decline from the 2000 peak. In fact, the summer rally in the airlines group fell short even of the peak established earlier in the spring. |

|
| The airlines go from boom to bust as part of this bearish complex head and shoulders top. |
| Graphic provided by: MetaStock. |
| |
| Such an inability to establish new highs is bearish in and of itself. But the particular series of peaks and troughs that developed in the S&P Airlines index from the spring of 2000 to the present is very much reminiscent of a multiple, or complex, head and shoulders top. Much like the common head and shoulders top, the multiple or complex version of this bearish reversal pattern consists of a series of attempts to establish a new high. When these attempts fail, prices often decline precipitously, reflecting the sudden change in sentiment from bullish to bearish. |
| The complex head and shoulders pattern in the S&P Airlines index consists of two left shoulders (peaks in the spring and summer of 2000), one head (peak in very late 2000), and two right shoulders (two peaks in the late spring). In most relevant respects, the complex head and shoulders top pattern acts like its more conventional head and shoulders top cousin: a neckline is marked by a straight line that connects the trough between the left shoulder and the head and extends rightward, forming support beneath the right shoulder. This neckline is the point beneath which prices are expected to break, preferably on abnormally high volume. |
| The S&P Airlines index shown here presents no volume data. But the price action may be compelling enough to make the point about the downside breakout from the complex head and shoulders top formation. The breakthrough week shows a fairly wide range and the subsequent week, with its much smaller range, may reflect a pullback attempt, perhaps as part of a response to a temporary oversold condition. In any event, the technical outlook for the airlines is as poor as the fundamental outlook. The standard measuring rule for complex head and shoulders tops, which calls for subtracting the formation height from the value at the neckline, suggests that the index could reach as low as 350 over the next year and a half. |
Technical Writer for Technical Analysis of STOCKS & COMMODITIES magazine, Working-Money.com, and Traders.com Advantage.
| Title: | Technical Writer |
| Company: | Technical Analysis, Inc. |
| Address: | 4757 California Avenue SW |
| Seattle, WA 98116 | |
| Phone # for sales: | 206 938 0570 |
| Fax: | 206 938 1307 |
| Website: | www.Traders.com |
| E-mail address: | DPenn@traders.com |
Traders' Resource Links | |
| Charting the Stock Market: The Wyckoff Method -- Books | |
| Working-Money.com -- Online Trading Services | |
| Traders.com Advantage -- Online Trading Services | |
| Technical Analysis of Stocks & Commodities -- Publications and Newsletters | |
| Working Money, at Working-Money.com -- Publications and Newsletters | |
| Traders.com Advantage -- Publications and Newsletters | |
| Professional Traders Starter Kit -- Software | |
Click here for more information about our publications!
Comments

Request Information From Our Sponsors
- StockCharts.com, Inc.
- Candle Patterns
- Candlestick Charting Explained
- Intermarket Technical Analysis
- John Murphy on Chart Analysis
- John Murphy's Chart Pattern Recognition
- John Murphy's Market Message
- MurphyExplainsMarketAnalysis-Intermarket Analysis
- MurphyExplainsMarketAnalysis-Visual Analysis
- StockCharts.com
- Technical Analysis of the Financial Markets
- The Visual Investor
- VectorVest, Inc.
- Executive Premier Workshop
- One-Day Options Course
- OptionsPro
- Retirement Income Workshop
- Sure-Fire Trading Systems (VectorVest, Inc.)
- Trading as a Business Workshop
- VectorVest 7 EOD
- VectorVest 7 RealTime/IntraDay
- VectorVest AutoTester
- VectorVest Educational Services
- VectorVest OnLine
- VectorVest Options Analyzer
- VectorVest ProGraphics v6.0
- VectorVest ProTrader 7
- VectorVest RealTime Derby Tool
- VectorVest Simulator
- VectorVest Variator
- VectorVest Watchdog
