HOT TOPICS LIST
- MACD
- Fibonacci
- RSI
- Gann
- ADXR
- Stochastics
- Volume
- Triangles
- Futures
- Cycles
- Volatility
- ZIGZAG
- MESA
- Retracement
- Aroon
INDICATORS LIST
LIST OF TOPICS
PRINT THIS ARTICLE
by Chaitali Mohile
Cisco breached a major resistance after a gap up followed by a bullish reversal candlestick pattern.
Position: Buy
Chaitali Mohile
Active trader in the Indian stock markets since 2003 and a full-time writer. Trading is largely based upon technical analysis.
PRINT THIS ARTICLE
CANDLESTICK CHARTING
A Big Bang By Cisco
07/24/09 02:24:53 PMby Chaitali Mohile
Cisco breached a major resistance after a gap up followed by a bullish reversal candlestick pattern.
Position: Buy
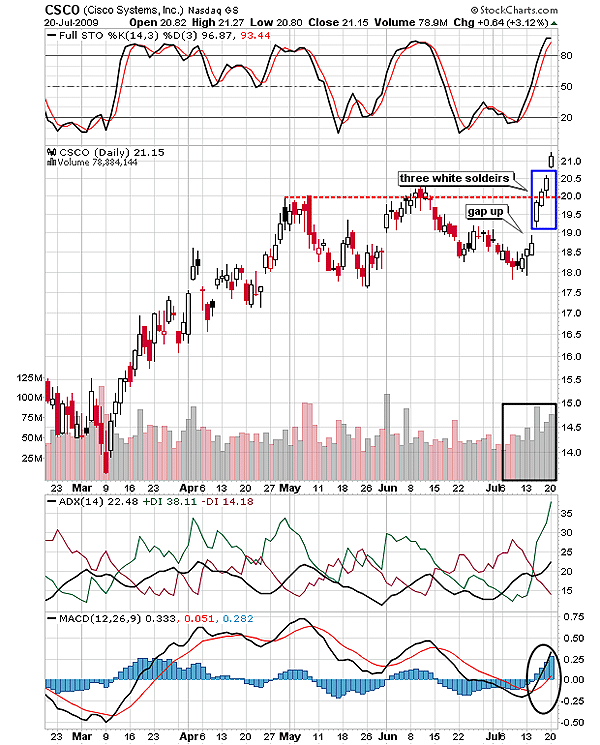
| Cisco Systems (CSCO) witnessed a wide trend reversal situation during the bullish rally. The stock rallied upward in highly volatile conditions due to the shaky trend. The average directional movement index (ADX) (14) in Figure 1 failed to surge above 20 levels with equal buying and selling pressure. The positive directional index (+DI) and the negative directional index (-DI) converged frequently, generating a huge pressure on the rally. The unstable moving average convergence/divergence (MACD (12,26,9) in positive territory indicated the volatile trading sessions. CSCO had a tough time at $20. The negative divergence of the full stochastic (14,3,3) stalled the rally at $20, and CSCO plunged to the nearest support at $18-$17.5.The new resistance ($20) was challenged twice, but the weak indicators suspended the rally, dragging it lower to the support. |
| The rally that began in early July was loaded with bullish strength, contradictory to the previous one. The white bullish candles are the highlights of the rally. By gapping upward, CSCO encouraged the buyers to reenter the stock. Therefore, the stock surged consecutively for three days on higher volume and breached the robust resistance at $20. The three bullish days formed a bullish reversal candlestick pattern -- three white soldiers. The buying pressure increased and the ADX (14) also surged above the 20 level. Hence, the weak trend reversed to a developing uptrend. Currently, the stochastic oscillator and the moving average convergence/divergence (MACD) (12,26,9) are bullish. In Figure 1, all the white candles are indicating consistent strength in the rally. Therefore, traders can initiate new long trades near $21 and enjoy the ride. |

|
| FIGURE 1: CSCO, DAILY. The three white soldiers candlestick pattern has closed above the resistance at $20. |
| Graphic provided by: StockCharts.com. |
| |
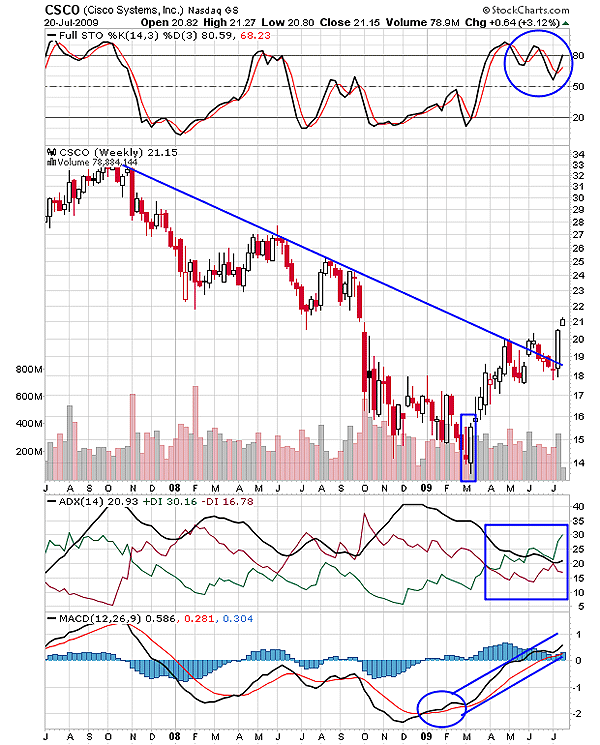
| On the weekly chart in Figure 2, the bullish rally in March began with the strong bullish notes. The rectangular box shows two candles with two different patterns. The bearish doji with a small lower shadow and long upper shadow is an inverted hammer -- a bullish reversal pattern, indicating the end of an existing bearish trend. The second long bullish candle has hugged the earlier inverted hammer along with the shadows, forming a bullish engulfing pattern. Thus, the two bullish reversal candlestick patterns initiated the robust upward rally. Accordingly, the ADX (14) went through a downtrend reversal with a spurt in the buying pressure, and the MACD (12,26,9) gradually turned positive as CSCO moved higher. In addition, the oversold stochastic (14,3,3) surged above the 20 level, inviting fresh buying opportunities at the bottom of the rally ($14). |

|
| FIGURE 2: CSCO, WEEKLY. An inverted hammer and the bullish engulfing pattern initiated the fresh upward rally in early March. The rally saturated near the descending trendline resistance. |
| Graphic provided by: StockCharts.com. |
| |
| During the corrective phase, the stock formed lower highs. A descending trendline joining these lower tops is extended right in Figure 2. The rally slowed near the trendline resistance and consolidated in a wide range between $18 and $20. But we can see that the large bullish candle has engulfed a few small bearish candles, suggesting developing bullish strength. In addition, the candle breached the trendline resistance. Thus, the breakout has converted the strong resistance to support. The bullish opening on July 20 above the newly formed support reconfirmed the breakout. The shaky stochastic oscillator has moved vertically upwards with the support of 50 levels. In addition, the MACD (12,26,9) is likely to shift in positive territory and the ADX (14) is reflecting a developing uptrend above 20 levels. |
| Thus, the robust breakout of CSCO is reconfirmed. The stock is likely to flow along with the current market conditions. Triggering new long positions at current levels can lead to an attractive profit. |
Active trader in the Indian stock markets since 2003 and a full-time writer. Trading is largely based upon technical analysis.
| Company: | Independent |
| Address: | C1/3 Parth Indraprasth Towers. Vastrapur |
| Ahmedabad, Guj 380015 | |
| E-mail address: | chaitalimohile@yahoo.co.in |
Traders' Resource Links | |
| Independent has not added any product or service information to TRADERS' RESOURCE. | |
Click here for more information about our publications!
Comments

Request Information From Our Sponsors
- VectorVest, Inc.
- Executive Premier Workshop
- One-Day Options Course
- OptionsPro
- Retirement Income Workshop
- Sure-Fire Trading Systems (VectorVest, Inc.)
- Trading as a Business Workshop
- VectorVest 7 EOD
- VectorVest 7 RealTime/IntraDay
- VectorVest AutoTester
- VectorVest Educational Services
- VectorVest OnLine
- VectorVest Options Analyzer
- VectorVest ProGraphics v6.0
- VectorVest ProTrader 7
- VectorVest RealTime Derby Tool
- VectorVest Simulator
- VectorVest Variator
- VectorVest Watchdog
- StockCharts.com, Inc.
- Candle Patterns
- Candlestick Charting Explained
- Intermarket Technical Analysis
- John Murphy on Chart Analysis
- John Murphy's Chart Pattern Recognition
- John Murphy's Market Message
- MurphyExplainsMarketAnalysis-Intermarket Analysis
- MurphyExplainsMarketAnalysis-Visual Analysis
- StockCharts.com
- Technical Analysis of the Financial Markets
- The Visual Investor
