HOT TOPICS LIST
- MACD
- Fibonacci
- RSI
- Gann
- ADXR
- Stochastics
- Volume
- Triangles
- Futures
- Cycles
- Volatility
- ZIGZAG
- MESA
- Retracement
- Aroon
INDICATORS LIST
LIST OF TOPICS
PRINT THIS ARTICLE
by Ron Walker
How will the head & shoulders pattern play out in the days ahead for the S&P 500?
Position: N/A
Ron Walker
Ron Walker is an active trader and technical analyst. He operates an educational website dedicated to the study of Technical Analysis. The website offers free market analysis with daily video presentations and written commentaries. Ron is a video pioneer, being one of the first to utilize the internet producing Technical Analysis videos. His website is thechartpatterntrader.com
PRINT THIS ARTICLE
REV HEAD & SHOULDERS
The Big Picture For The S&P 500
07/22/09 11:11:11 AMby Ron Walker
How will the head & shoulders pattern play out in the days ahead for the S&P 500?
Position: N/A
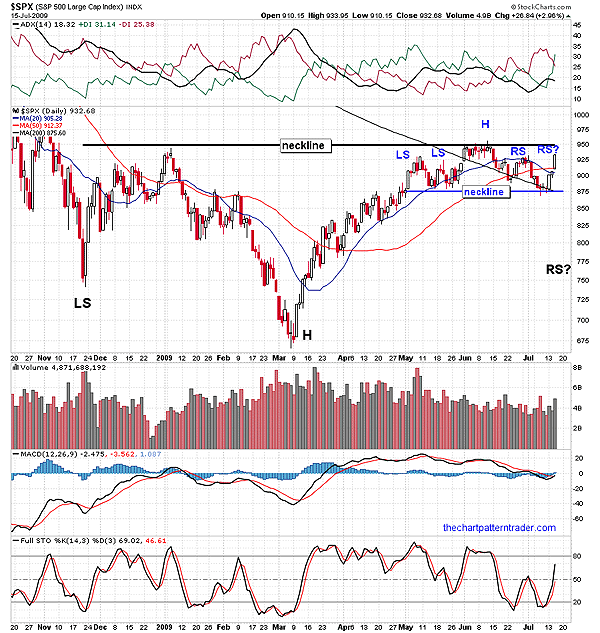
| The Standard & Poor's 500 is currently in the process of forming a head & shoulders (H&S) pattern of the complex class in the daily time frame (Figure 1). If the pattern runs its course and prices close below the confirmation of 879, it would allow a much larger pattern to set up on the S&P 500. A very large inverse head & shoulders pattern has been setting up since last November. In Figure 1, the left shoulder can be seen at the November 21st low. The market rallied off those lows to January, where prices stalled at 944. Things really got ugly for the next two months until prices bottomed on March 6, 2009, putting in a momentous low of 666. The S&P 500 staged an impressive comeback, racking up one of the largest bull runs in history. Eventually, prices broke down from a bearish rising wedge. From there the index drifted sideways, forming a 10-week head & shoulders topping pattern. If the pattern breaks down and prices begin to freefall, we could see the right shoulder of the larger pattern form. |

|
| FIGURE 1: $SPX, DAILY. There is a head & shoulders top-reversal pattern brewing over SPX. If we close below 879, a right shoulder will likely form in a much larger inverse H&S pattern. |
| Graphic provided by: StockCharts.com. |
| |
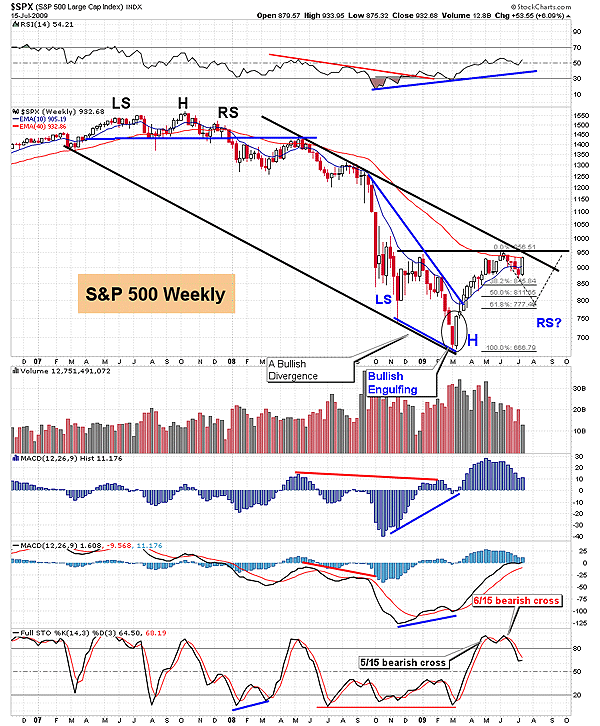
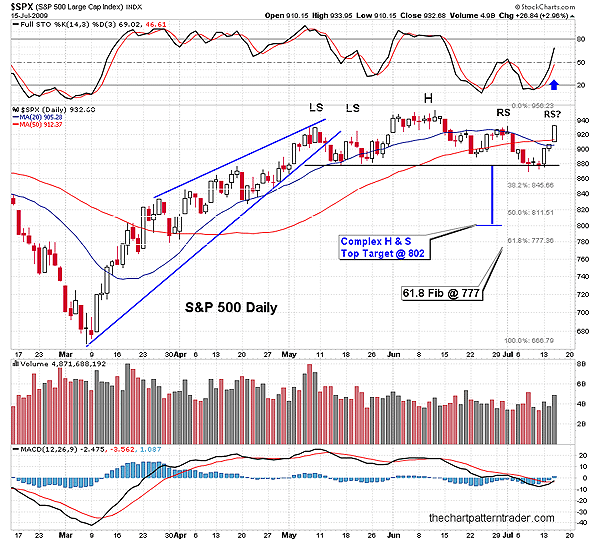
| The first possible target where prices might be contained if a selloff occurs is at the measurement of the H&S top. By taking the peak of the pattern (the highest point on the head) and subtracting it from the neckline at 879, we get a measurement of 77 points with an objective target of 802. The target is calculated by subtracting the measurement from the neckline (879 - 77 = 802). Another target is the 61.8 % Fibonacci percent retracement from the March 6th low at 666. If prices retraced 61.8% of the run from 666 to 956, it would retrace to 777. These Fibonacci retracements can be seen in both Figures 2 and 3. |

|
| FIGURE 2: $SPX, WEEKLY. The weekly chart shows that the current rally will soon run into resistance at the primary downward trendline. This increases the odds that a second right shoulder will form on the H&S top, resulting in a summer selloff. Note the 61.8 % Fibonacci retracement coming in at 777. |
| Graphic provided by: StockCharts.com. |
| |
| Figure 2 shows the weekly chart and a silhouette of a very large right shoulder. Note the resistance from the primary trendline that prices are currently encountering, as the second right shoulder tries to form on the smaller H&S top pattern. That level of resistance may allow the H&S top to play out and set up the right shoulder on the larger inverse H&S pattern over the summer and early autumn. Then once the correction is done, prices can rise to break the primary trendline and move higher to test the neckline of the pattern near 944. If prices can break above the neckline of this pattern, it would likely end the bear market. |

|
| FIGURE 3: $SPX, DAILY. In this closeup of the daily chart, we see the moving average convergence/divergence (MACD) turning bullish below zero and the stochastic clearing 50 as SPX slams into resistance. If a second right shoulder forms, the S&P 500 will be ripe for reversal. The 61.8% Fibonacci at 777 is just underneath the target of the price pattern. |
| Graphic provided by: StockCharts.com. |
| |
| A third possibility is that prices put in an equivalent intraday low in proportion to the left shoulder made back on November 21, 2008, at 741. All three targets have credibility, but we must first see the smaller head & shoulders top-reversal pattern break down in order for the big picture pattern to come into play. This bullish long-term scenario is predicated on the assumption that a higher low forms on the weekly S&P 500 chart to complete the pattern, and that higher highs will follow, ultimately confirming the pattern's validity. So let's see if the H&S top plays out in the days ahead and whether prices can be contained at one of the support levels discussed. |
Ron Walker is an active trader and technical analyst. He operates an educational website dedicated to the study of Technical Analysis. The website offers free market analysis with daily video presentations and written commentaries. Ron is a video pioneer, being one of the first to utilize the internet producing Technical Analysis videos. His website is thechartpatterntrader.com
| Website: | thechartpatterntrader.com |
| E-mail address: | thechartpatterntrader@gmail.com |
Click here for more information about our publications!
Comments
Date: 07/23/09Rank: 3Comment:

Request Information From Our Sponsors
- StockCharts.com, Inc.
- Candle Patterns
- Candlestick Charting Explained
- Intermarket Technical Analysis
- John Murphy on Chart Analysis
- John Murphy's Chart Pattern Recognition
- John Murphy's Market Message
- MurphyExplainsMarketAnalysis-Intermarket Analysis
- MurphyExplainsMarketAnalysis-Visual Analysis
- StockCharts.com
- Technical Analysis of the Financial Markets
- The Visual Investor
- VectorVest, Inc.
- Executive Premier Workshop
- One-Day Options Course
- OptionsPro
- Retirement Income Workshop
- Sure-Fire Trading Systems (VectorVest, Inc.)
- Trading as a Business Workshop
- VectorVest 7 EOD
- VectorVest 7 RealTime/IntraDay
- VectorVest AutoTester
- VectorVest Educational Services
- VectorVest OnLine
- VectorVest Options Analyzer
- VectorVest ProGraphics v6.0
- VectorVest ProTrader 7
- VectorVest RealTime Derby Tool
- VectorVest Simulator
- VectorVest Variator
- VectorVest Watchdog
