HOT TOPICS LIST
- MACD
- Fibonacci
- RSI
- Gann
- ADXR
- Stochastics
- Volume
- Triangles
- Futures
- Cycles
- Volatility
- ZIGZAG
- MESA
- Retracement
- Aroon
INDICATORS LIST
LIST OF TOPICS
PRINT THIS ARTICLE
by Ron Walker
Over the last 10 weeks, the S&P 500 has been carving out a complex head & shoulders top-reversal pattern. But is the pattern starting to slip away from the bears? Are they laying the ground work for a summer selloff, or will the bulls rehabilitate and manage to resurrect the rally?
Position: N/A
Ron Walker
Ron Walker is an active trader and technical analyst. He operates an educational website dedicated to the study of Technical Analysis. The website offers free market analysis with daily video presentations and written commentaries. Ron is a video pioneer, being one of the first to utilize the internet producing Technical Analysis videos. His website is thechartpatterntrader.com
PRINT THIS ARTICLE
HEAD & SHOULDERS
Closing The Sale On The S&P 500
07/21/09 11:50:16 AMby Ron Walker
Over the last 10 weeks, the S&P 500 has been carving out a complex head & shoulders top-reversal pattern. But is the pattern starting to slip away from the bears? Are they laying the ground work for a summer selloff, or will the bulls rehabilitate and manage to resurrect the rally?
Position: N/A
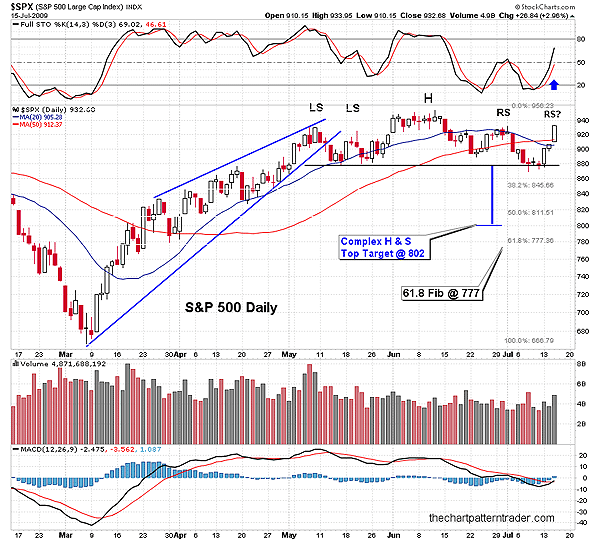
| The Standard & Poor's 500 (SPX) daily chart reveals that it has been struggling through a 10-week top-reversal pattern (Figure 1). The daily chart exhibits that a complex head & shoulders pattern has been under construction ever since the intermediate trendline broke down on May 13, 2009. This top-reversal pattern has the ability to bring any flourishing advance to a screeching halt. In Figure 1, we can see that the pattern formed when the S&P 500 was in a powerful uptrend and rose to make new highs. Once prices peaked in May, they fell back to a level of support and stabilization. This completed the first left shoulder. The bulls made another stab at moving to a new high, but the S&P 500 turned tail and ran at resistance, testing the floor support again at 879. This formed the second left shoulder. Then the new buyers with fresh money came in to buy the pullback and started snatching up shares, thinking that they are getting bargains. These Johnny-come-latelys who come in to follow the herd of bulls drove prices back up, exceeding the previous highs near the 930 level (the two left shoulders). Three wide range candles carried prices straight up to make new highs as May was closing out and June was coming in. |

|
| FIGURE 1: $SPX, DAILY. The daily chart shows lackluster volume trends are supporting this rally, which suggests short-covering. Nevertheless, the MACD did get a bullish cross but remains below the zero line. The stochastic gained traction as it sped away from 50. Conflicting signals place one big question mark over this rally. |
| Graphic provided by: StockCharts.com. |
| |
| The waters got choppy over the next two weeks as a series of perpetual buyers came in while the early birds started selling into the rallies. Ultimately, the S&P 500 became overbought as the new money ran out, no longer propping up prices. Taking the path of least resistance, prices sank back below the 20-day simple moving average (SMA), sliding back to test the previous support made by the two left shoulders in an abbreviated low. The S&P 500 wasn't quite as feeble and put in a higher low at 888. This completed the head. A halfhearted rally carried prices and put in a lower high as the S&P 500 reversed hard at the 20-day SMA. Prices immediately slipped back to support, putting in a lower low. The S&P 500 had an intraday move below the 879 neckline of support, but prices did not close below it. There, three narrow-range spinning-top candles formed and halted selling as the first right shoulder completed. After skidding back to support, previous resistance was tested at 932, made during the first right shoulder (Figure 1). This rally was ignited by investors who became optimistic about the banking and technology sectors once again. This sparked a three-day winning streak and took the S&P 500 up by approximately 6%. |
| Overzealous bulls are now prematurely proclaiming that the correction is over. Are they being a bit hasty? There are several reasons to call this rally into question. The volume for all three days of the rally was much lighter than one would expect to see on a 6% move higher. So far, this rally is based on the flawed perception that there are an army of buyers out there waiting to snap up shares at any price, when in fact, the volume trends have all the earmarks of prices being tweaked by short-covering. Unless the bulls make an 11th-hour decision to change course, we should see the second right shoulder sculpted out, completing a complex head & shoulders top. The pattern is balanced, having two shoulders on the left and right. It boils down to this: Who is going to take hold of the stringent controls of market direction? If the right shoulder is completed, the bears will take decisive action and put the final nail in the coffin, formulating a conclusion to the pattern. The bullish compelling argument is that the moving average convergence/divergence (MACD) (12, 26, 9) got a bullish cross on the third day of the rally. Further, the stochastic pushed above 50, tilting momentum in favor of the bulls. Not so fast! The MACD is still below its median line and the stochastic failed to rise to overbought territory after a 6% rally. Other bulls are quick to point out that prices are back above the 20- and 50-day simple moving averages (SMAs). But every good trader knows that prices must have staying power. And a good rule of thumb is for price to be able to sustain itself above the 20-day SMA for at least three days to ensure that a rally isn't a bull trap. |

|
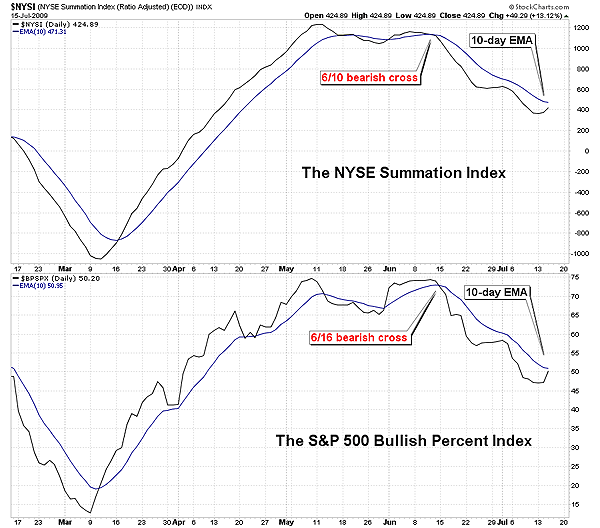
| FIGURE 2: THE NYSE SUMMATION INDEX, DAILY, THE S&P 500 BULLISH PERCENT INDEX. Here we can see that so far the market breadth indicators are not confirming the bullilsh cross made on the MACD of the daily chart of the S&P 500. Here, both indexes are shown with their 10-day EMAs, which is a popular setting among traders. |
| Graphic provided by: StockCharts.com. |
| |
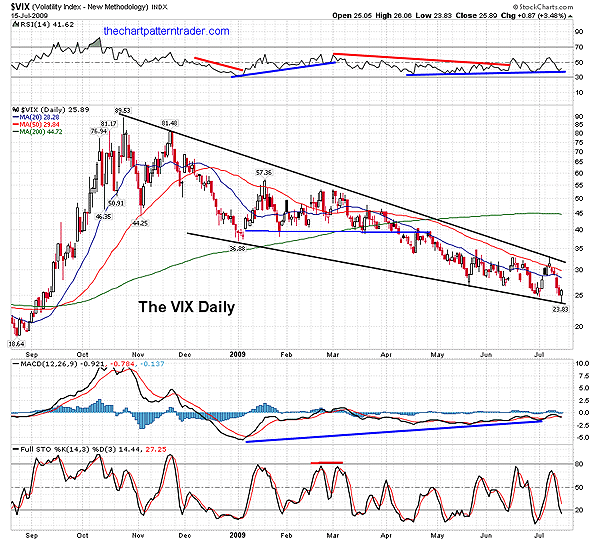
| Other problems with the rally is that it halted at resistance near 932. The S&P 500 is still finding resistance at the last lower high, not to mention the lackluster volume mentioned previously. In Figure 2 we can see that the bullish percentage of the S&P 500 has not moved above its 10-day exponential moving average (EMA). A moving average confirmation watched by many traders. In addition, the McClellan Summation Index (also seen in Figure 2), which is used to gauge the flow of money moving in and out of the market, failed to cross above its 10-day EMA. So far, neither index is willing to confirm the bullish cross made on the MACD of the S&P's 500 daily chart. The volatility index (VIX) also suggests that it is probably sporting a bullish falling wedge on its daily chart, as well as a bullish divergence on the MACD in that time frame (Figure 3). I'm not trying to debate the nitty-gritty of whether this pattern plays out; the bulls could very well intercept the ball here just before the bears make a touchdown. But I can tell you that if the bulls don't step up to the plate here, resistance will stop the advance dead in its tracks. Right now, it looks like it's over at this late stage of the game, but the bulls are still holding on to hope, trying to prop up prices. |

|
| FIGURE 3: VIX, DAILY. As the second right shoulder was being carved out on the daily chart of the S&P 500, the VIX was busy testing the lower boundary of its bullish falling wedge. Note how the RSI is in a lockstep with the move, testing its own rising trendline. Note the bullish divergences on both the RSI and the MACD. |
| Graphic provided by: StockCharts.com. |
| |
| Personally, I'm rather bearish right now. As tempting as it is to disregard this rally, I find it disturbing how permabulls or bears alike often dig their heels into the ground and make a stand for a particular bias. As traders we must remain flexible. It's still possible that this pesky pattern may not want to cooperate. But at the same time, prices could reverse as fast as they rose and closed below the neckline of the pattern at 879. Then we would likely see prices start to retrace to at least the minimum objective target of the H&S top pattern at 802. I am obviously not yet convinced that this rally has any staying power. Nevertheless, as a trader I recognize that I must remain flexible and not bury my head in the sand. If the bulls are committed, we'll know it soon. If the bulls drop the ball, then it is the bears' game to lose. So let's watch to see if the S&P 500 can close the sale on this bearish pattern by concluding the last right shoulder. |
Ron Walker is an active trader and technical analyst. He operates an educational website dedicated to the study of Technical Analysis. The website offers free market analysis with daily video presentations and written commentaries. Ron is a video pioneer, being one of the first to utilize the internet producing Technical Analysis videos. His website is thechartpatterntrader.com
| Website: | thechartpatterntrader.com |
| E-mail address: | thechartpatterntrader@gmail.com |
Click here for more information about our publications!
Comments
Date: 07/22/09Rank: 5Comment:

Request Information From Our Sponsors
- StockCharts.com, Inc.
- Candle Patterns
- Candlestick Charting Explained
- Intermarket Technical Analysis
- John Murphy on Chart Analysis
- John Murphy's Chart Pattern Recognition
- John Murphy's Market Message
- MurphyExplainsMarketAnalysis-Intermarket Analysis
- MurphyExplainsMarketAnalysis-Visual Analysis
- StockCharts.com
- Technical Analysis of the Financial Markets
- The Visual Investor
- VectorVest, Inc.
- Executive Premier Workshop
- One-Day Options Course
- OptionsPro
- Retirement Income Workshop
- Sure-Fire Trading Systems (VectorVest, Inc.)
- Trading as a Business Workshop
- VectorVest 7 EOD
- VectorVest 7 RealTime/IntraDay
- VectorVest AutoTester
- VectorVest Educational Services
- VectorVest OnLine
- VectorVest Options Analyzer
- VectorVest ProGraphics v6.0
- VectorVest ProTrader 7
- VectorVest RealTime Derby Tool
- VectorVest Simulator
- VectorVest Variator
- VectorVest Watchdog
