HOT TOPICS LIST
- MACD
- Fibonacci
- RSI
- Gann
- ADXR
- Stochastics
- Volume
- Triangles
- Futures
- Cycles
- Volatility
- ZIGZAG
- MESA
- Retracement
- Aroon
INDICATORS LIST
LIST OF TOPICS
PRINT THIS ARTICLE
by Chaitali Mohile
After a robust bullish breakout, Citrix Systems (CTXS) headed north and covered a relatively long distance establishing strong support.
Position: Buy
Chaitali Mohile
Active trader in the Indian stock markets since 2003 and a full-time writer. Trading is largely based upon technical analysis.
PRINT THIS ARTICLE
CHART ANALYSIS
An Up Swing In Citrix Systems
07/20/09 01:02:46 PMby Chaitali Mohile
After a robust bullish breakout, Citrix Systems (CTXS) headed north and covered a relatively long distance establishing strong support.
Position: Buy
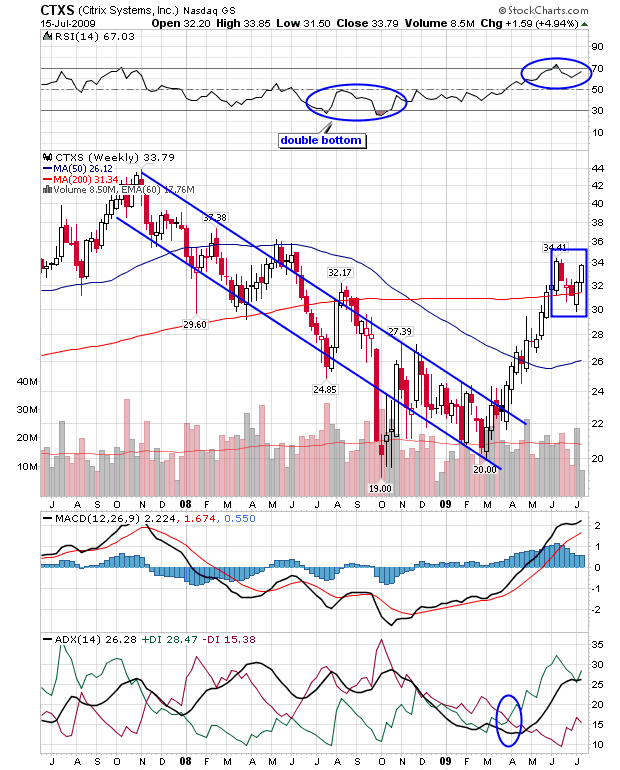
| Recently, a long-term downtrend in CTXS reversed with a channel breakout in April 2009. The lower trendline of the descending channel was breached in October 2008, dragging CTXS to a new low at $19. But the relative strength index that formed a double bottom encouraged the bullish force and lifted the stock back within the channel. The RSI (14) surged above an oversold level, rallying higher in a strong bullish area above the 50 levels. The higher low at $20 generated positive sentiments among the traders, and as a result, the volume improved. Therefore, the channel breakout occurred on robust bullish strength, encouraging volume and the downtrend reversal indication by the average directional index (ADX) (14). As can be seen in Figure 1, the ADX (14) moved above the 20 level with high buying pressure. The moving average convergence/divergence (MACD) (12,26,9) also surged above the zero line, generating positive momentum during the breakout. |

|
| FIGURE 1: CTXS, WEEKLY. The exclusive bullish rally converted the 200-day MA resistance to support, and thereafter consolidated. |
| Graphic provided by: StockCharts.com. |
| |
| Thus, the bull's ride soon converted the 200-day moving average (MA) resistance to support, and hit the high at $34. CTXS has retraced towards the newly formed support, indicating the possibility of consolidation. The stock in Figure 1 is ready to breach the upper consolidation range at $34. The sideways price action formed a short-term bullish flag & pennant continuation pattern that usually breaks in an upward direction. The RSI (14) is indicating the healthy bullish strength, the MACD (12,26,9) is positive, and the ADX (14) suggests a developing uptrend. Therefore, the pattern breakout is engulfed with bullish force. The potential target is 34-24=10+34(breakout level) = 44; coincidently, $44 is the previous high resistance in Figure 1. Hence, the current bullish scenario would very likely pull the rally higher towards resistance and meet the calculated target. |
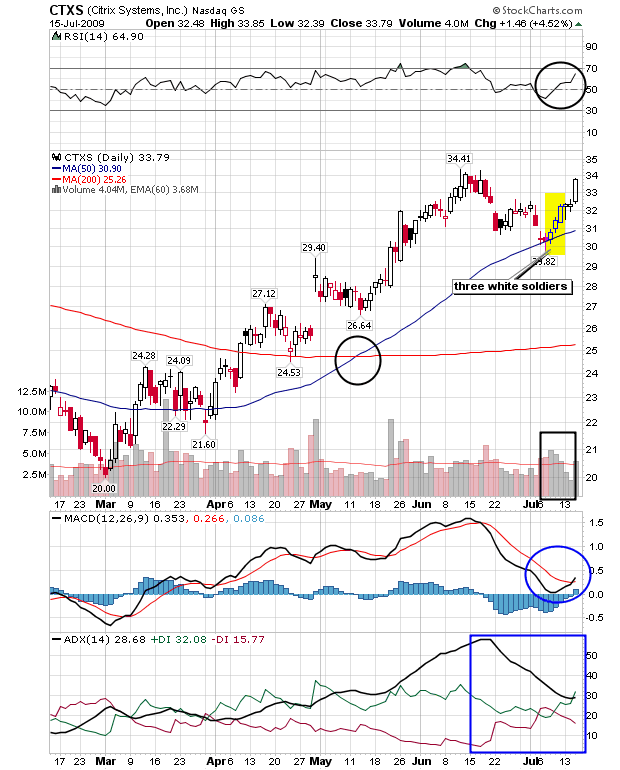
| The daily chart in Figure 2 will help to chalk-out the road map for short-term traders. The picture on the daily time frame is very bullish. The bullish crossover of the moving average (circle in Figure 2) encouraged the upward journey by extending the strong support of the 50-day moving average (MA). During the pullback rally from the fresh support, CTXS formed a bullish candlestick pattern: three white soldiers. The yellow block in Figure 1, shows three bullish candles, opening within the body of the previous candles and closing at a new high. The uptrend that was weakening after an exclusive advance rally turned stronger and resumed its journey in the developing area above the 25 levels. |

|
| FIGURE 2: CTXS, DAILY. The three white soldiers were formed with the support of 50-day MA. |
| Graphic provided by: StockCharts.com. |
| |
| The MACD (12,26,9) is likely to undergo a bullish crossover, and the RSI (14) is indicating bullish strength. CTXS is likely to surge towards its immediate resistance at $34.41. The indicators are healthily bullish so there is a strong chance that the previous high resistance will be violated. The three-white soldiers reversal pattern would boost the bullish strength in the rally and carry the stock higher. In the worst case scenario, CTXS might consolidate marginally near $34.41 before initiating a new bullish rally. |
| Thus, CTXS is a strong and healthy stock for trading. The stock might swing higher above resistance; therefore, $35 might be a good place to enter a long trade. |
Active trader in the Indian stock markets since 2003 and a full-time writer. Trading is largely based upon technical analysis.
| Company: | Independent |
| Address: | C1/3 Parth Indraprasth Towers. Vastrapur |
| Ahmedabad, Guj 380015 | |
| E-mail address: | chaitalimohile@yahoo.co.in |
Traders' Resource Links | |
| Independent has not added any product or service information to TRADERS' RESOURCE. | |
Click here for more information about our publications!
PRINT THIS ARTICLE

Request Information From Our Sponsors
- StockCharts.com, Inc.
- Candle Patterns
- Candlestick Charting Explained
- Intermarket Technical Analysis
- John Murphy on Chart Analysis
- John Murphy's Chart Pattern Recognition
- John Murphy's Market Message
- MurphyExplainsMarketAnalysis-Intermarket Analysis
- MurphyExplainsMarketAnalysis-Visual Analysis
- StockCharts.com
- Technical Analysis of the Financial Markets
- The Visual Investor
- VectorVest, Inc.
- Executive Premier Workshop
- One-Day Options Course
- OptionsPro
- Retirement Income Workshop
- Sure-Fire Trading Systems (VectorVest, Inc.)
- Trading as a Business Workshop
- VectorVest 7 EOD
- VectorVest 7 RealTime/IntraDay
- VectorVest AutoTester
- VectorVest Educational Services
- VectorVest OnLine
- VectorVest Options Analyzer
- VectorVest ProGraphics v6.0
- VectorVest ProTrader 7
- VectorVest RealTime Derby Tool
- VectorVest Simulator
- VectorVest Variator
- VectorVest Watchdog
